DeepSpeed Observability and Autotuning
导言
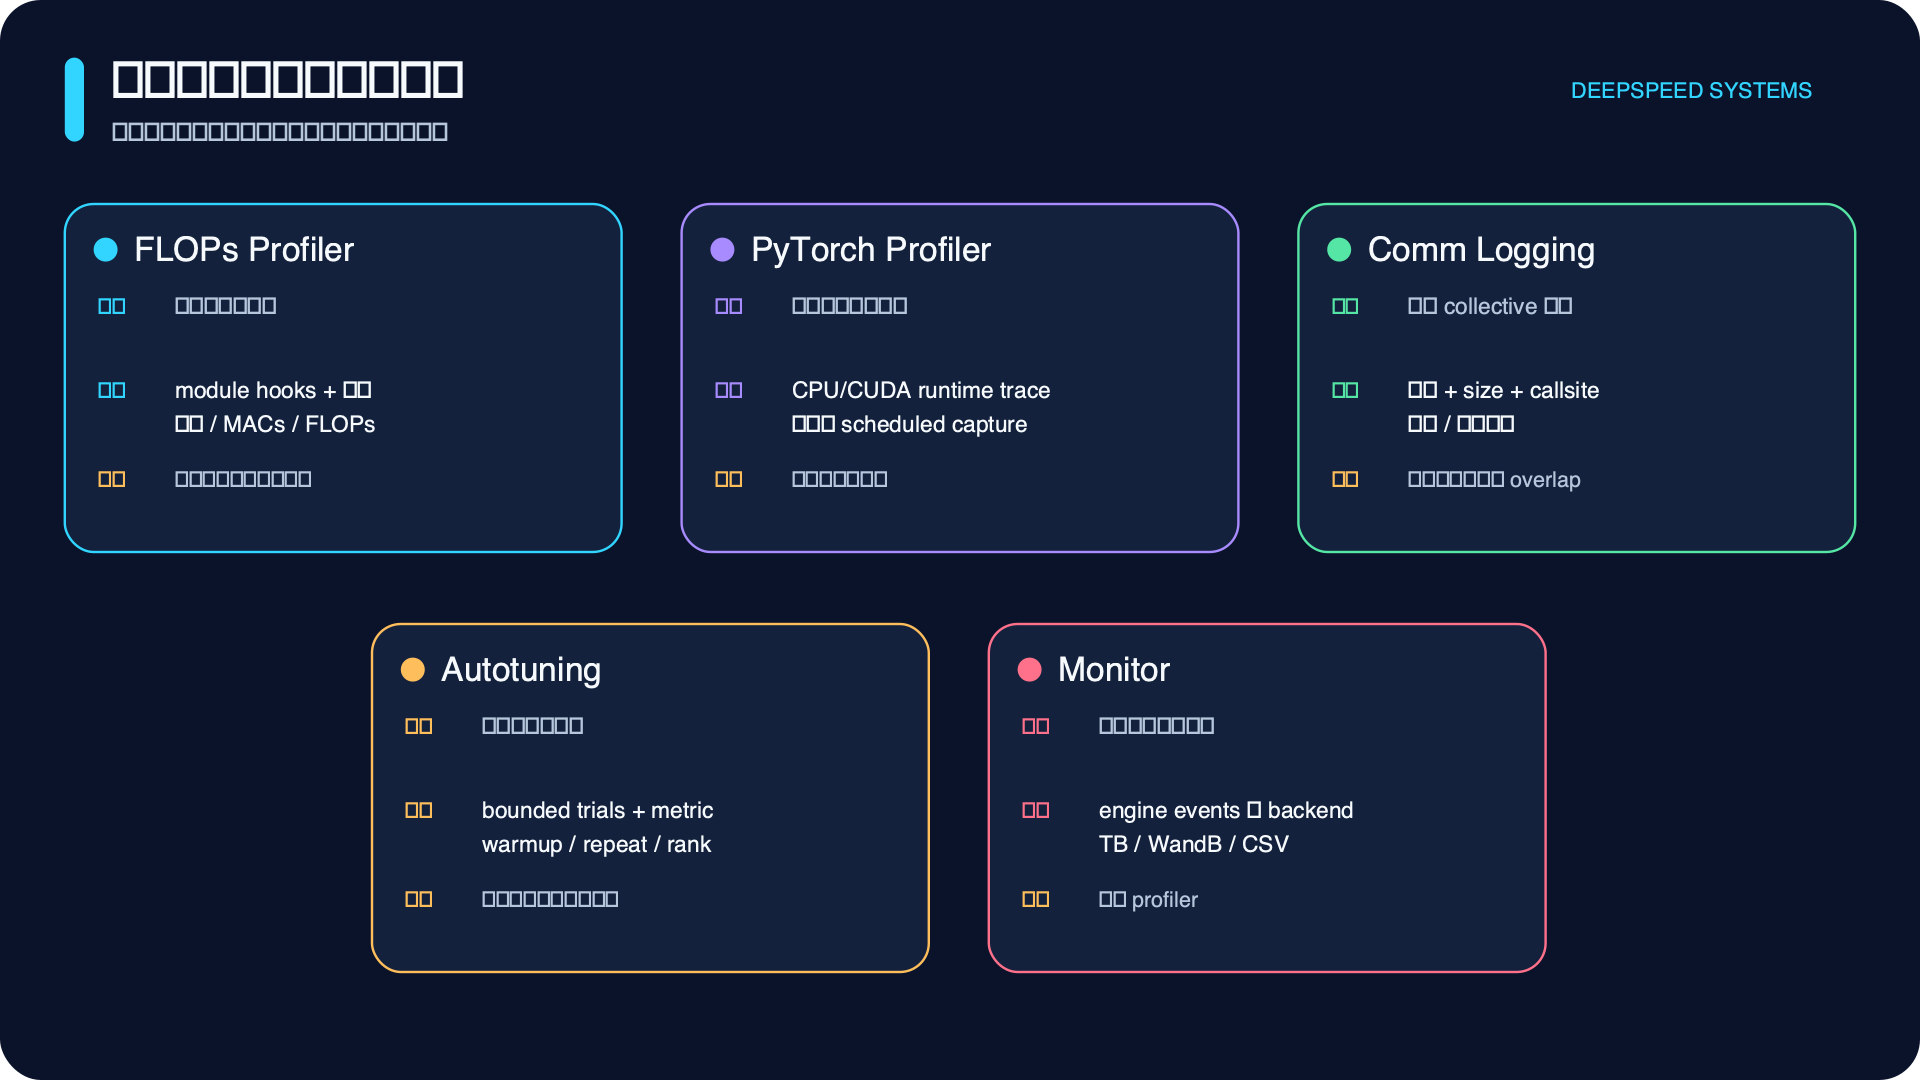
DeepSpeed 的五个观测工具不是重复功能:FLOPs Profiler 回答“理论计算在哪”,PyTorch Profiler 回答“时间实际花在哪”,Communication Logging 回答“哪类 collective 在拖慢”,Autotuning 回答“哪个配置在当前目标上更好”,Monitor 回答“实验长期发生了什么”。
FLOPs Profiler:结构化估算,不是硬件利用率
FLOPs Profiler 通过 module hooks 和算子公式聚合参数量、MACs/FLOPs、时延与吞吐。1
对矩阵乘 \(A_{m\times k}B_{k\times n}\),常用口径是
profiler.start_profile()
loss = model(batch)
profiler.stop_profile()
report = profiler.aggregate_by_module()
profiler.end_profile()
它适合找结构热点、核对模型计算预算。自定义算子和融合 kernel 可能缺少公式;同样 FLOPs 在不同 shape、dtype 和 kernel 上的时间可以完全不同,所以不能用估算 FLOPs 直接计算真实 MFU,除非分子和硬件峰值口径一致。
PyTorch Profiler:捕获真实 CPU/CUDA 时间线
PyTorch Profiler 记录 operator、CUDA kernel、shape、stack、memory 和 trace。DeepSpeed 教程展示如何用 schedule 只采集有限 step,避免全程追踪。2
with profile(
    activities=[CPU, CUDA],
    schedule=schedule(wait=1, warmup=1, active=3, repeat=1),
    record_shapes=True,
    profile_memory=True,
    on_trace_ready=tensorboard_trace_handler(logdir),
) as prof:
    for batch in loader:
        engine.train_batch(batch)
        prof.step()
分析时要区分 CPU 提交与 GPU 执行:CPU op 很短不等于 kernel 很短,CUDA API 很长也可能是同步点替之前的 GPU 工作“买单”。多 Rank trace 还需要统一时间基准和 step 边界。
Communication Logging:把 NCCL 时间拆回 collective
Communication Logging 包装 DeepSpeed communication backend,记录 collective 名称、消息大小、调用点、次数、时延和带宽。3
configure_comms_logger(
    enabled=True,
    prof_all=False,
    prof_ops=["all_reduce", "all_gather", "reduce_scatter", "all_to_all"],
    verbose=True,
)
train_one_bounded_window()
summary = collect_comms_summary()
它回答的是:
- 是 AllGather、ReduceScatter 还是 All-to-All 暴露?
- 大消息带宽不足,还是大量小消息延迟主导?
- 哪个 module/调用点触发?
计时往往需要同步,可能破坏原本 overlap。应把 logger-on 用于定位,把 logger-off 用于最终性能数字。
Autotuning:搜索实验,不是性能魔法
Autotuning 在 micro-batch、ZeRO stage 和相关配置空间运行 trial,用吞吐等 metric 排序并支持 early stopping。4
best = None
for config in bounded_search_space:
    if not memory_feasible(config):
        continue
    warmup(config)
    samples = repeat_measure(config, n=3)
    score = robust_median(samples)
    if stable(samples) and better(score, best):
        best = (config, score)
publish(best, environment_fingerprint)
一个可信搜索至少固定:
- 模型 revision、数据与 sequence distribution;
- 节点/GPU/网络拓扑和软件版本;
- warmup、采样次数与异常值规则;
- 正确性门槛和 OOM/失败分类;
- metric 定义,例如 samples/s、tokens/s 或成本,而不是混用。
若运行环境噪声比候选差异大,自动调优只会自动选择噪声。
Monitor:把训练事件写成可比较的长期记录
Monitor 用统一 config 接入 TensorBoard、WandB 和 CSV 等后端。它记录 loss、learning rate、samples/s 及用户指标,属于实验可观测性,不是 profiler。5
{
  "tensorboard": {"enabled": true, "output_path": "logs/tb", "job_name": "run"},
  "wandb": {"enabled": true, "group": "deepspeed-study"},
  "csv_monitor": {"enabled": true, "output_path": "logs/csv"}
}
日志必须带上 global samples/tokens、world size、gradient accumulation、模型与代码 revision。只用 step 对齐不同 batch 语义的实验,曲线可能看似可比但实际训练 token 不同。
推荐诊断闭环
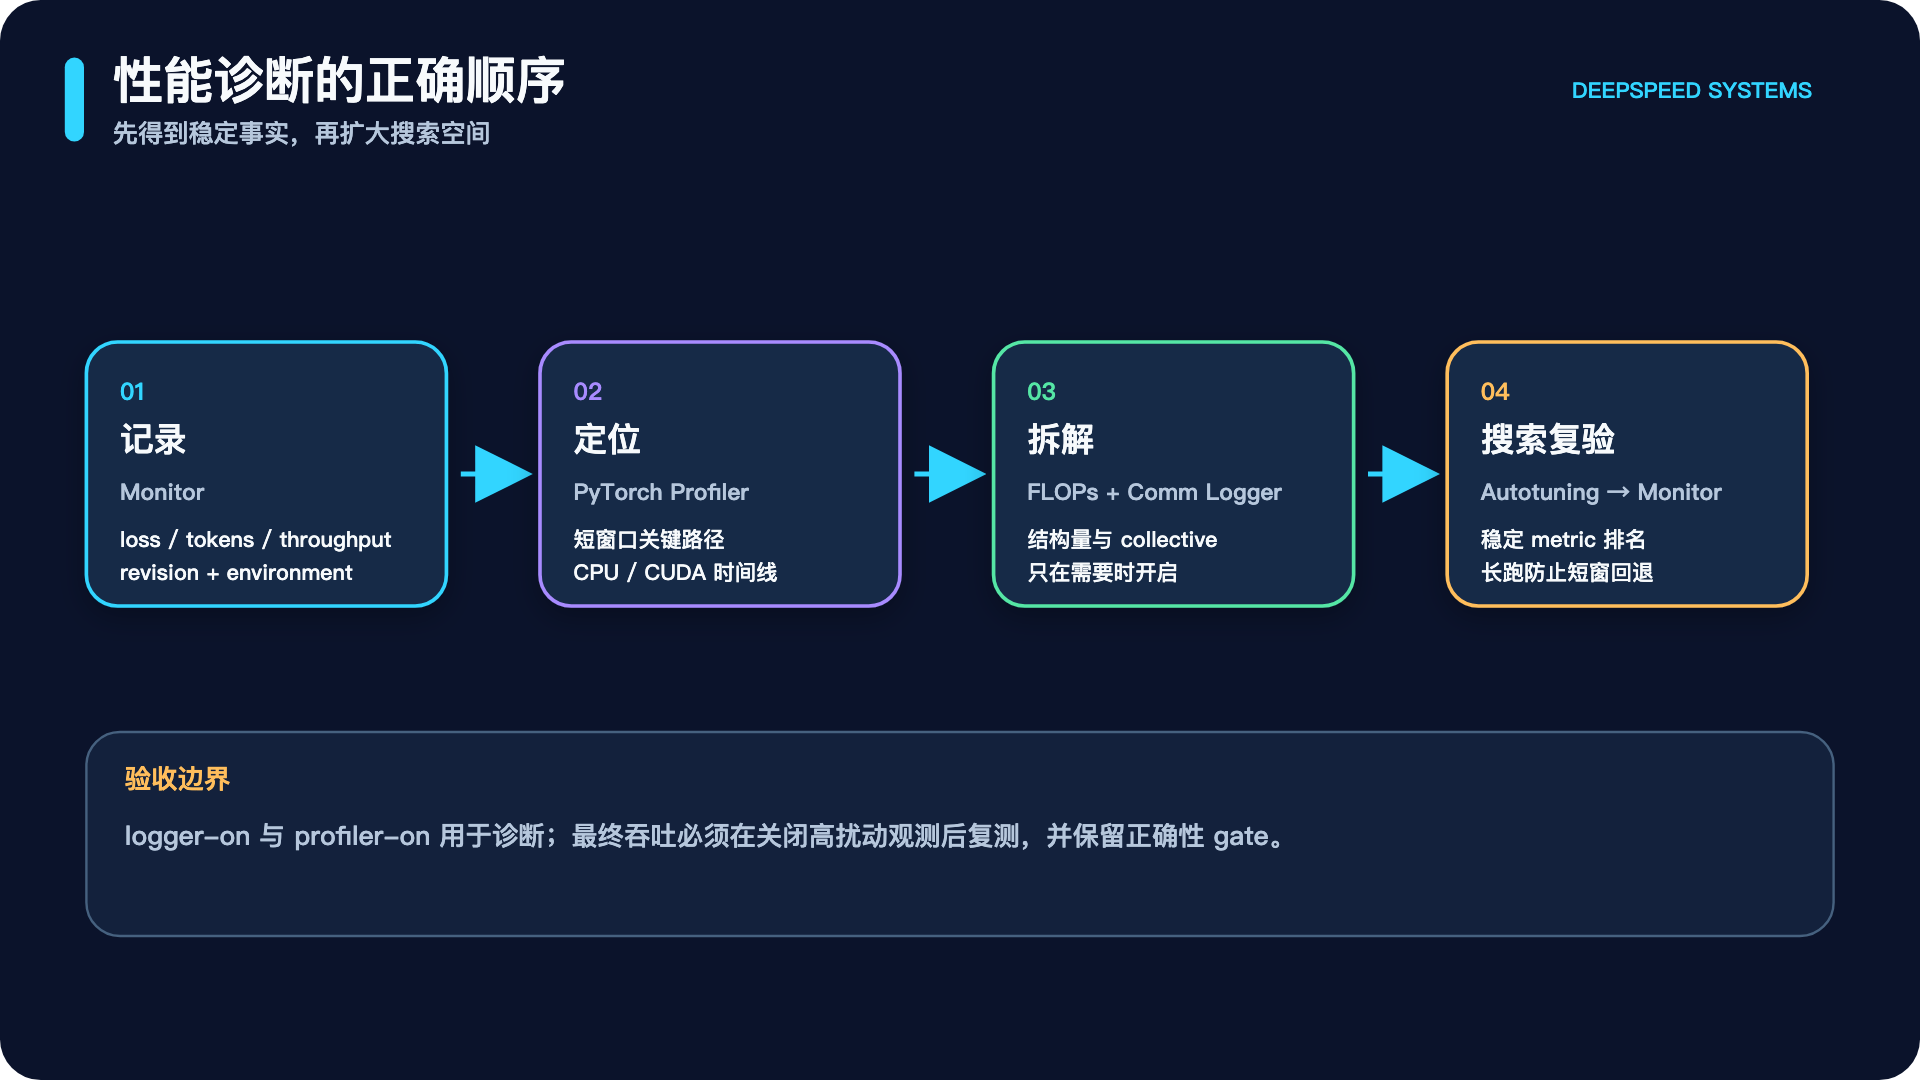
- Monitor 发现吞吐下降、loss 异常或长期漂移。
- PyTorch Profiler 在可复现窗口中捕获关键路径。
- Communication Logging 仅在 trace 指向 collective 时进一步拆解。
- FLOPs Profiler 对照理论结构,判断是算子低效还是模型本就计算密集。
- Autotuning 在稳定基线、明确 metric 和正确性 gate 后搜索。
- 用 Monitor 记录候选配置的长跑结果,防止短窗口最优在完整训练中回退。
| 问题 | 工具 | 错用方式 |
|---|---|---|
| 哪层理论计算多? | FLOPs Profiler | 把 FLOPs 当实测时延 |
| CPU/GPU 时间花在哪? | PyTorch Profiler | 全程采集导致巨大扰动 |
| 哪个 collective/尺寸慢? | Communication Logging | 用 logger-on 数字做最终吞吐 |
| 哪个配置对当前目标好? | Autotuning | 未固定环境、只测一次 |
| 训练长期是否稳定? | Monitor | 把日志曲线当 kernel trace |
结论
观测系统的价值来自问题与工具一一对应。先记录,再用短窗口 trace,必要时拆通信,最后才搜索配置。这样才能把一次“看起来更快”的试验变成可复现、可解释、可长期验证的工程结论。
-
DeepSpeed FLOPs Profiler tutorial,教程文件最早提交于 2021-02-10。 ↩
-
PyTorch Profiler with DeepSpeed,教程文件最早提交于 2021-09-21。 ↩
-
Communication Logging tutorial,教程文件最早提交于 2022-07-25。 ↩
-
DeepSpeed Autotuning tutorial,教程文件最早提交于 2021-11-13。 ↩
-
DeepSpeed Monitor tutorial,教程文件最早提交于 2022-06-16。 ↩