Perf
简介
- pref
- kperf :
./kperf_static --pid 1043785 --topdown --cache --tlb --imix --uncore --duration 3 --iter-num 1
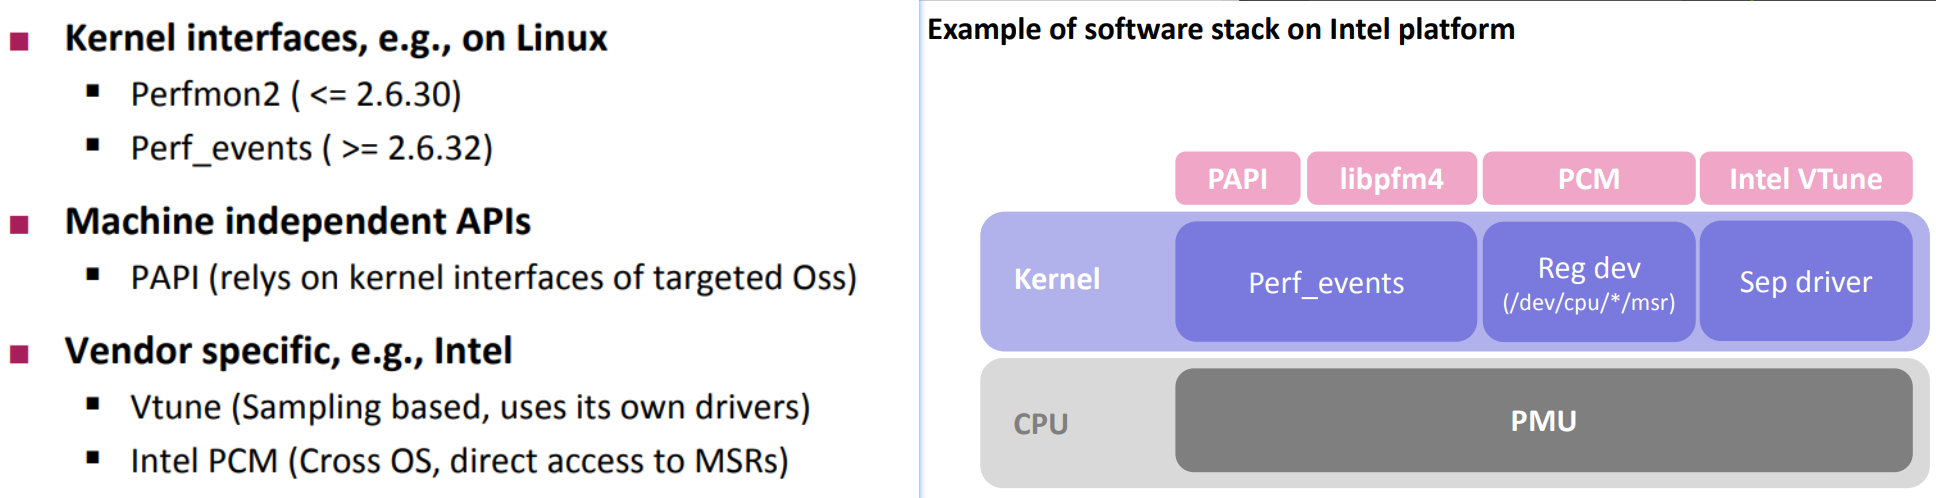
perf 介绍
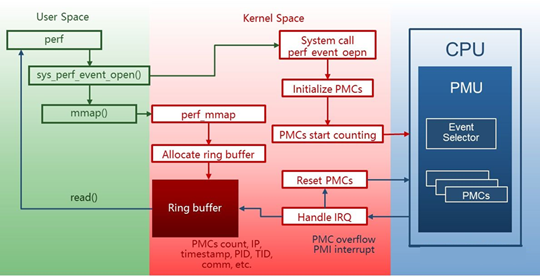
Perf是Linux下的一个性能分析工具(profiler)。基于Linux 内核perf_event子系统实现。
Perf不仅能够分析 PMU 事件(硬件事件),也能分析各种软件事件,如进程切换、pagefault、网络、文件IO等。
常用perf命令
间隔选项
-I 100 以100ms为间隔打印数据
性能事件的属性
硬件性能事件由处理器中的PMU提供支持。由于现代处理器的主频非常高,再加上深度流水线机制,从性能事件被触发,到处理器响应 PMI中断,流水线上可能已处理过数百条指令。
那么PMI中断采到的指令地址就不再是触发性能事件的那条指令的地址了,而且可能具有非常严重的偏差。
为了解决这个问题,Intel处理器通过PEBS机制实现了高精度事件采样。PEBS通过硬件在计数器溢出时将处理器现场直接保存到内存(而不是在响应中断时才保存寄存器现场),从而使得 perf能够采到真正触发性能事件的那条指令的地址,提高了采样精度。
在默认条件下,perf不使用PEBS机制。用户如果想要使用高精度采样,需要在指定性能事件时,在事件名后添加后缀”:p”或”:pp”。Perf在采样精度上定义了4个级别,如下表所示。
级别描述
  0 无精度保证
  1 采样指令与触发性能事件的指令之间的偏差为常数(:p)
  2 需要尽量保证采样指令与触发性能事件的指令之间的偏差为0(:pp)
  3 保证采样指令与触发性能事件的指令之间的偏差必须为0(:ppp)
  性能事件的精度级别目前的X86处理器,包括Intel处理器与AMD处理器均仅能实现前 3 个精度级别。
除了精度级别以外,性能事件还具有其它几个属性,均可以通过”event: X”的方式予以指定。
标志属性
  u 仅统计用户空间程序触发的性能事件
  k 仅统计内核触发的性能事件,有些根据寄存器计数器获得的数值,无法区分内核态还是用户态产生。
  uk 测量两者的合
  h 仅统计Hypervisor触发的性能事件
  G 在KVM虚拟机中,仅统计Guest系统触发的性能事件
  H 仅统计 Host 系统触发的性能事件
  p 精度级别
perf list
列出可采集事件(to be used in -e).
常用的集合事件 Metric Groups: perf list metricgroup
perf stat
可以列出程序运行的基本分析数据,或者特殊指明事件
$ perf stat ./bin/pivot "../run/uniformvector-2dim-5h.txt"
dim = 2, n = 500, k = 2
Using time : 236.736000 ms
max : 143 351 58880.823709
min : 83 226 21884.924801

 Performance counter stats for './bin/pivot ../run/uniformvector-2dim-5h.txt':

          7,445.60 msec task-clock                #   30.814 CPUs utilized
               188      context-switches          #    0.025 K/sec
                33      cpu-migrations            #    0.004 K/sec
               678      page-faults               #    0.091 K/sec
    14,181,698,360      cycles                    #    1.905 GHz                      (75.63%)
    46,455,227,542      instructions              #    3.28  insn per cycle           (74.37%)
     2,008,507,493      branches                  #  269.758 M/sec                    (74.18%)
        13,872,537      branch-misses             #    0.69% of all branches          (75.82%)

       0.241629599 seconds time elapsed

       7.448593000 seconds user
       0.000000000 seconds sys
Using Metric Groups: perf stat -M Summary,TLB --metric-only ./exe
--metric-only will just print calculated metric without raw data.
perf record
Run a command and record its profile into perf.data
must add perf record -g xxx to generate perf report topdown graph
不指定 -e 默认 -e cycles:u 。要统计全部的周期使用 -e cycles:uk
注意周期和指令统计的是多核的。选项-a可以指定所有核。
cycles和task-clock基本差不多
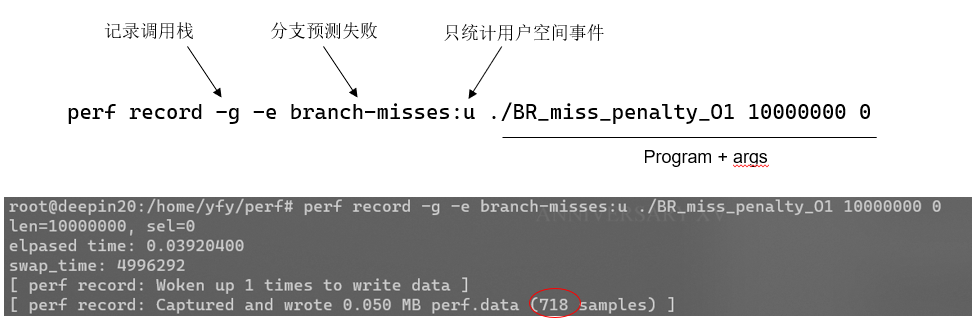
在测试时加上 uppp 的p提高精度,防止采样偏移到其他指令。
perf record -g -e branch-misses:uppp ./bin/pivot "../run/uniformvector-2dim-5h.txt"
perf record -g -e task-clock:uppp ./bin/pivot "../run/uniformvector-2dim-5h.txt"
可以看出分支失败在for循环这里
echo 0 > /proc/sys/kernel/kptr_restrict is needed.
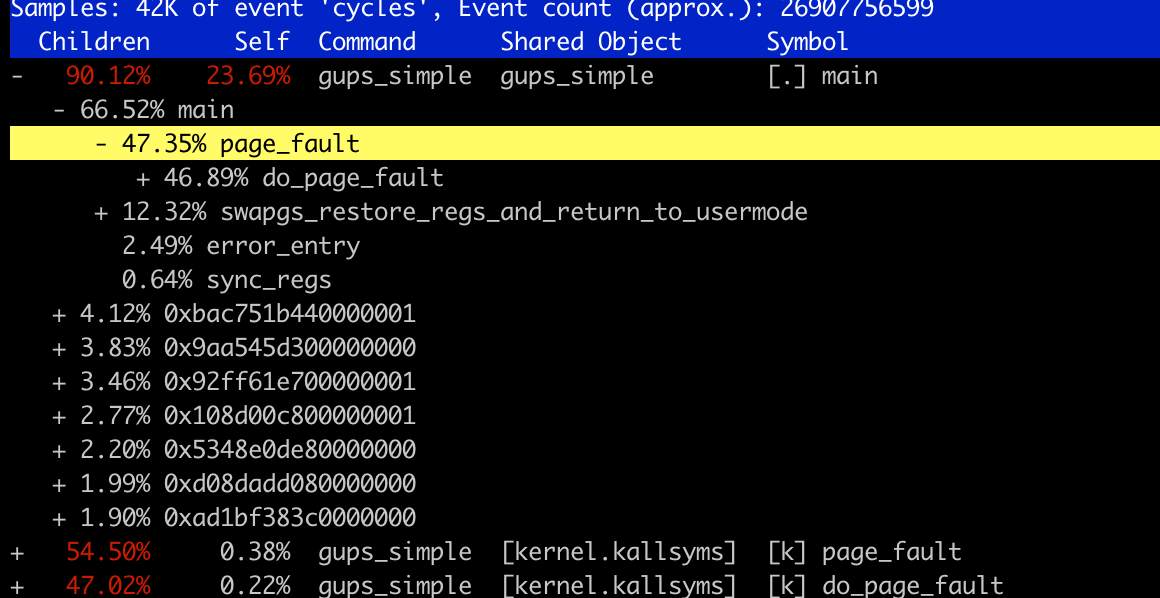
perf report
Read perf.data (created by perf record) and display the profile
可交互的命令行。不仅可以显示出汇编和原代码的对应关系,还可以jump自动跳转
perf annotate
- program compiled in
-gflag perf annotatecan show each line execution cycles percentage
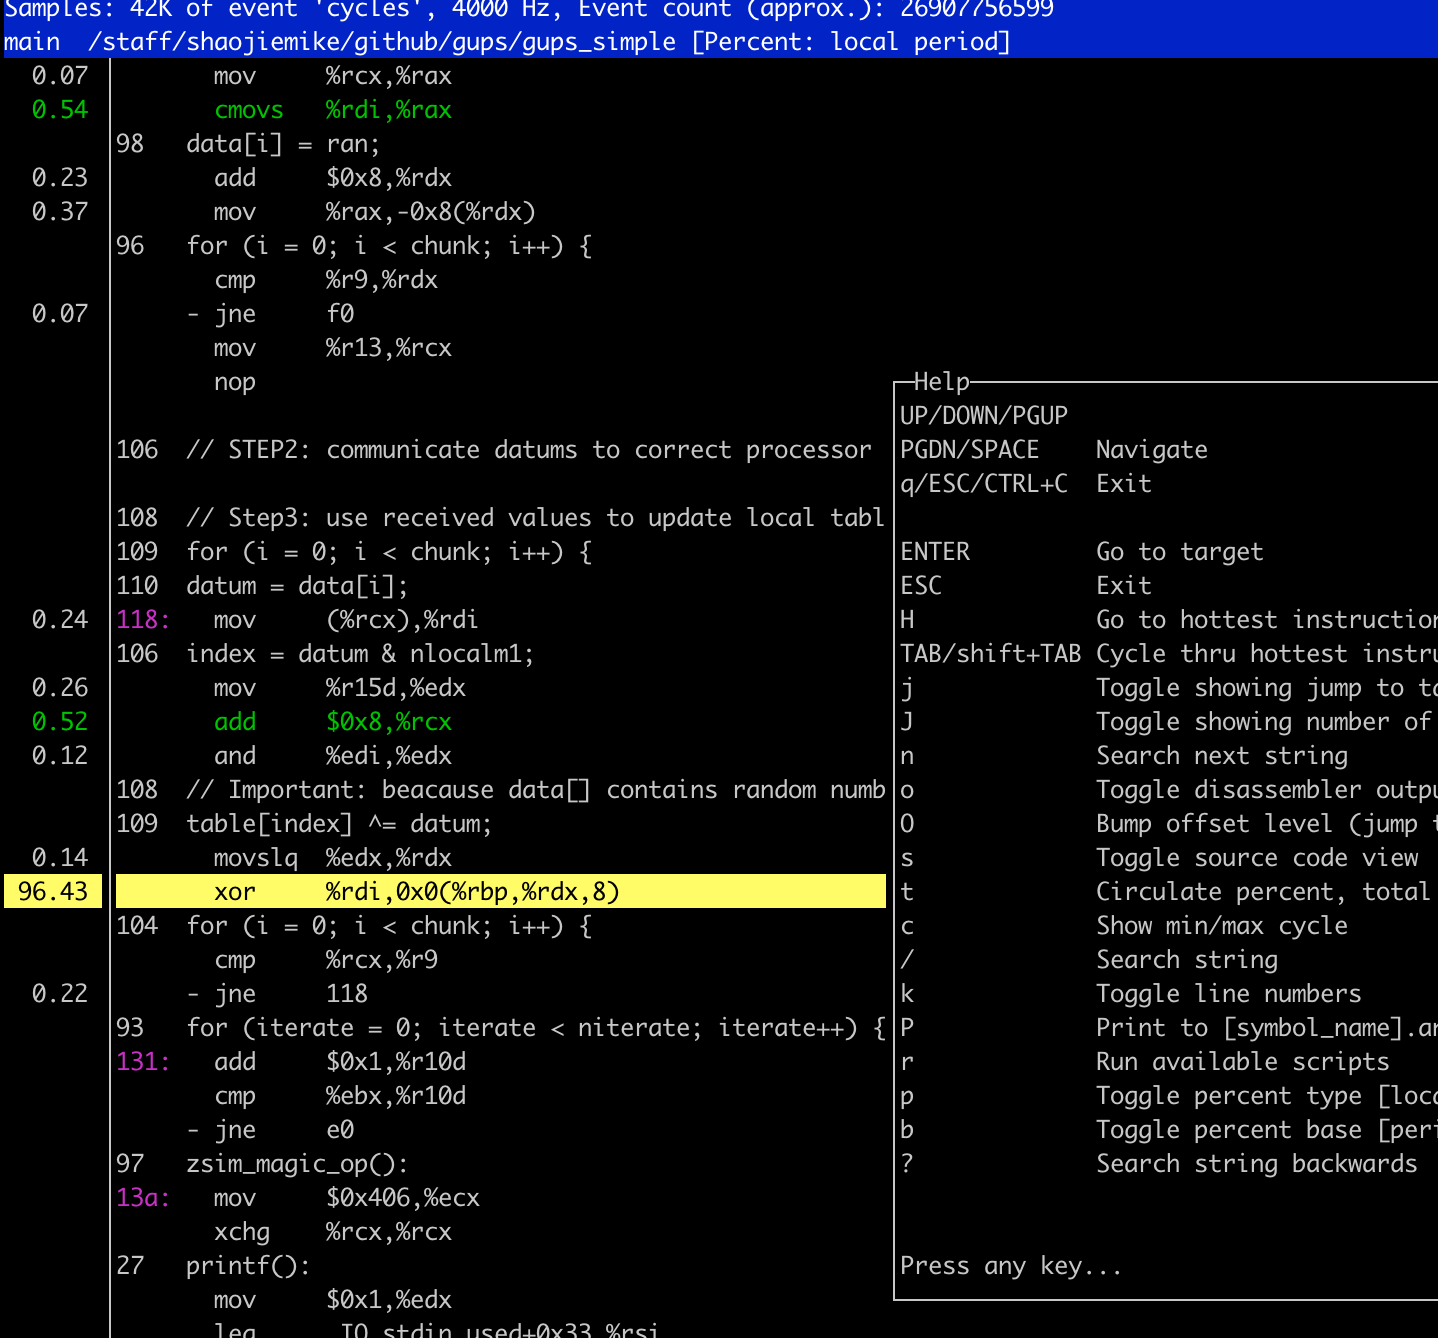
percentage at the end of each line
When you select many metric using -e option, but there is limited PMU hardware to use. So perf using Event multiplexing
to measure parttime data to estimate the full data. the % is the parttime / fulltime
pmc-tools
实践
Because of perf estimation, when numbers bigger than 10^9, the math relationship is more convincible.
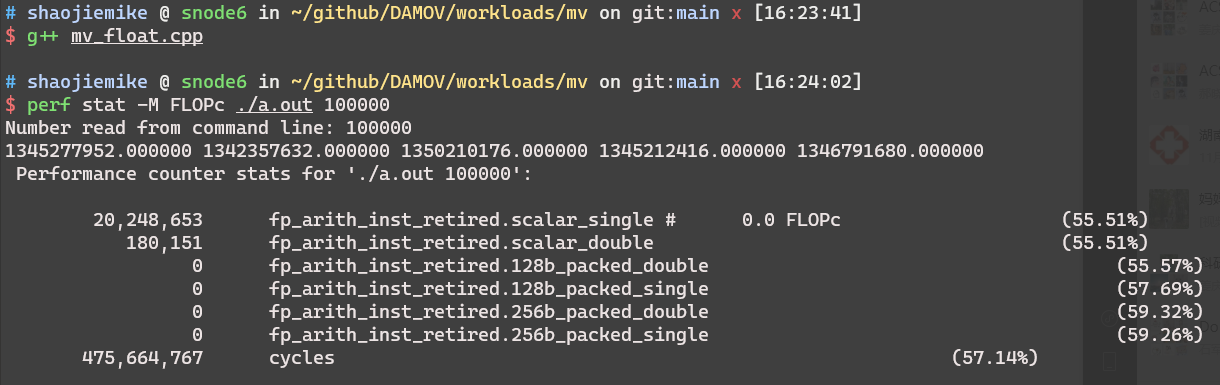
Integer Operations per seconds (IntOps)
No integer-ralated state But float in perf list
- perf is hard to measure int
- Check raw hardware event codes (to be used with -rNNN) also difficult choice
TLB miss rate
reference inspire me in snode6
- Total number of memory references ( X ) =
mem_uops_retired.all_loads+mem_uops_retired.all_stores - Total number of memory references that missed in TLB ( Y ) =
mem_uops_retired.stlb_miss_loads+mem_uops_retired.stlb_miss_stores - TLB miss rate = Y/X
perf stat \
    -e mem_uops_retired.all_loads \
    -e mem_uops_retired.all_stores \
    -e mem_uops_retired.stlb_miss_loads \
    -e mem_uops_retired.stlb_miss_stores xxx
according to the following experience, mem_uops_retired.stlb_miss_stores is equal to dtlb_store_misses.miss_causes_a_walk.
$ perf stat -e mem_uops_retired.all_loads -e mem_uops_retired.all_stores -e mem_uops_retired.stlb_miss_loads -e mem_uops_retired.stlb_miss_stores -e dtlb_load_misses.miss_causes_a_walk\
    -e dtlb_store_misses.miss_causes_a_walk \
    -e itlb_misses.miss_causes_a_walk  \
    -e dtlb_load_misses.walk_duration \
    -e dtlb_store_misses.walk_duration \
    -e itlb_misses.walk_duration \
    -e instructions:uk \
    -e cycles:uk ./bigJump.exe 1 10 500
Number read from command line: 1 10 (N,J should not big, [0,5] is best.)
result 0
 Performance counter stats for './bigJump.exe 1 10 500':

           3253636      mem_uops_retired.all_loads                                     (41.53%)
         529570049      mem_uops_retired.all_stores                                     (41.62%)
             59111      mem_uops_retired.stlb_miss_loads                                     (41.71%)
         471688964      mem_uops_retired.stlb_miss_stores                                     (33.50%)
            101474      dtlb_load_misses.miss_causes_a_walk                                     (33.56%)
         477591045      dtlb_store_misses.miss_causes_a_walk                                     (33.47%)
             61667      itlb_misses.miss_causes_a_walk                                     (33.37%)
           5591102      dtlb_load_misses.walk_duration                                     (33.28%)
       16489869334      dtlb_store_misses.walk_duration                                     (33.22%)
           2202174      itlb_misses.walk_duration                                     (33.22%)
        3712587926      instructions:uk           #    0.34  insn per cycle           (41.52%)
       10791067051      cycles:uk                                                     (41.52%)
perf测量 page walk 时间占比
脚本如下:
# Intel(R) Xeon(R) CPU E5-2695 v4 @ 2.10GHz
USER="/staff/qcjiang/codes/PIA_workspace"
APP="$USER/workloads/pagerank/cpp/pagerank $USER/workloads/pagerank/test/barabasi-100000-pr-p.txt"
perf stat \
    -e dtlb_load_misses.miss_causes_a_walk\
    -e dtlb_store_misses.miss_causes_a_walk \
    -e itlb_misses.miss_causes_a_walk  \
    -e dtlb_load_misses.walk_duration \
    -e dtlb_store_misses.walk_duration \
    -e itlb_misses.walk_duration \
    -e instructions:uk \
    -e cycles:uk \
    $APP

# dtlb_load_misses.walk_duration
# [Cycles when PMH(Page Miss Handling) is busy with page walks Spec update: BDM69]

# Intel(R) Xeon(R) Platinum 8358 CPU @ 2.60GH
perf stat\
    -e dtlb_load_misses.walk_completed\
    -e dtlb_load_misses.walk_active\
    -e dtlb_store_misses.walk_completed\
    -e dtlb_store_misses.walk_active\
    -e itlb_misses.walk_completed\
    -e itlb_misses.walk_active\


# different perf on hades0 AMD cpu
# AMD do not have the page walk time record
perf stat\
 -e ls_l1_d_tlb_miss.all\
 -e l1_dtlb_misses\
 -e l2_dtlb_misses\
 -e l2_itlb_misses\
 -e bp_l1_tlb_miss_l2_tlb_miss\
 -e bp_l1_tlb_miss_l2_tlb_miss.if2m\
 -e bp_l1_tlb_miss_l2_tlb_miss.if4k\
 -e bp_l1_tlb_miss_l2_tlb_miss.if1g\
 -e ls_tablewalker.dc_type0\
 -e ls_tablewalker.dc_type1\
 -e ls_tablewalker.dside\
 -e ls_tablewalker.ic_type0\
 -e ls_tablewalker.ic_type1\
 -e ls_tablewalker.iside -e instructions:uk -e cycles:uk /staff/shaojiemike/github/DAMOV/workloads/gemm/gemm 2000
统计TLB miss的性能事件可以帮助分析程序是否存在地址翻译方面的性能瓶颈。STLB miss通常表示存储指令无法利用局部性,访问了过多随机地址。优化程序的数据访问模式可以减少TLB miss。
-I 100 以100ms为间隔打印数据
$ ./investigation/pagewalk/tlbstat -c '/staff/shaojiemike/github/sniper_PIMProf/PIMProf/gapbs/sssp.inj -f /staff/shaojiemike/github/sniper_PIMProf/PIMProf/gapbs/benchmark/kron-20.wsg -n1'
command is /staff/shaojiemike/github/sniper_PIMProf/PIMProf/gapbs/sssp.inj -f /staff/shaojiemike/github/sniper_PIMProf/PIMProf/gapbs/benchmark/kron-20.wsg -n1
K_CYCLES   K_INSTR      IPC DTLB_WALKS ITLB_WALKS K_DTLBCYC  K_ITLBCYC  DTLB% ITLB%
186001     83244       0.45 753584     63         27841      1          14.97  0.00
229121     89734       0.39 1009100    213        31103      10         13.58  0.00
6233833    3629907     0.58 1227653    316159     45877      8347        0.74  0.13
16579329   8756681     0.53 10860225   524414     264655     15348       1.60  0.09
- obs1: 前期读取数据部分DTLB大
- obs2: cycle数前面是单核,后面是32核。而且读取时与计算时的core动态频率也不同。
- 根据
lscpu的结果。最高3.3GHz, min 1.2GHz.2*32*33/12 = 176 ~ 165。符合预期。 - obs3: 可以不考虑kernel。内核操作(malloc空间)的浮动很大。
为什么强调是Retired
在Intel处理器中,不是所有的存储指令(store uops)都会退休(retire)执行。具体来说,有以下几种情况:
- 存储指令被重排序或规避了,没有真正执行,所以不会退休。
- 存储指令执行期间遇到异常,被取消了,同样不会退休。
- 优化后的微操作 fusion 可能会 cancel 掉冗余的存储指令,这些指令也不会退休。
- 硬件优化会将多个存储指令合并(coalescing)为一个存储指令执行,其它冗余指令不会退休。
综上所述,不是所有的存储指令都会 retirement,其中有一部分指令因为各种原因被取消或合并了。
所以这个事件“Retired store uops” 特别强调统计的是执行完整并退休的存储指令。只统计退休的存储指令,可以更准确地反映程序实际进行了存储操作的次数。如果包含被取消的指令,会引入噪声,影响分析结果。
此外,TLB miss只发生在指令真正要执行时,那时已经可以确定指令确实会退休,不会被取消。
进阶应用:
改变数据规模好方式,统计该函数花费的cycle,斜率即CPE(cycles per element)
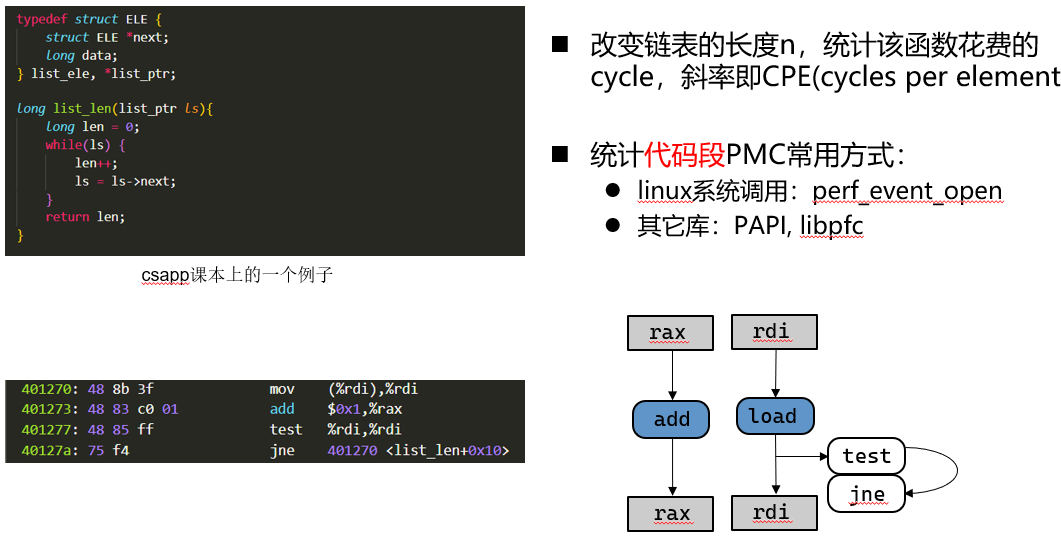
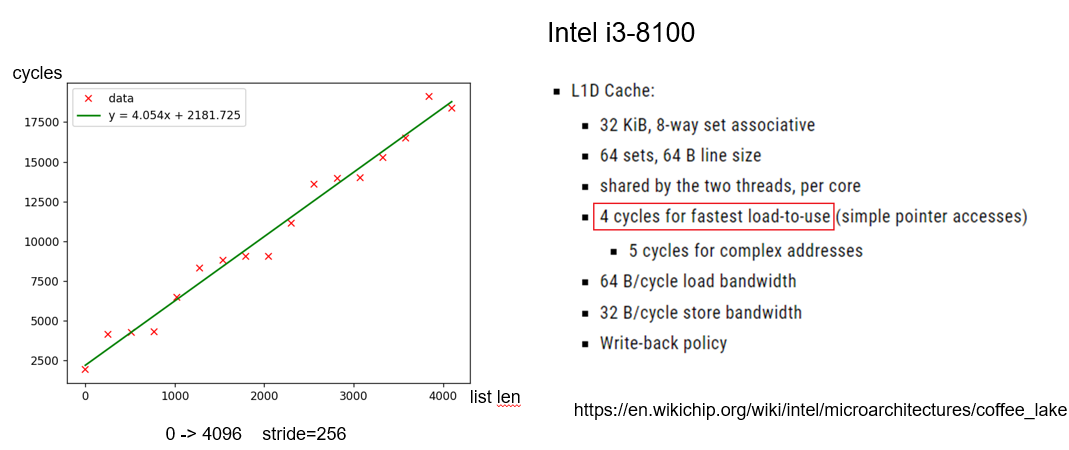
Perf stat例子: 通过CPE估计L1 Cache latency
改变链表的长度n,统计该函数花费的cycle,斜率即CPE(cycles per element)
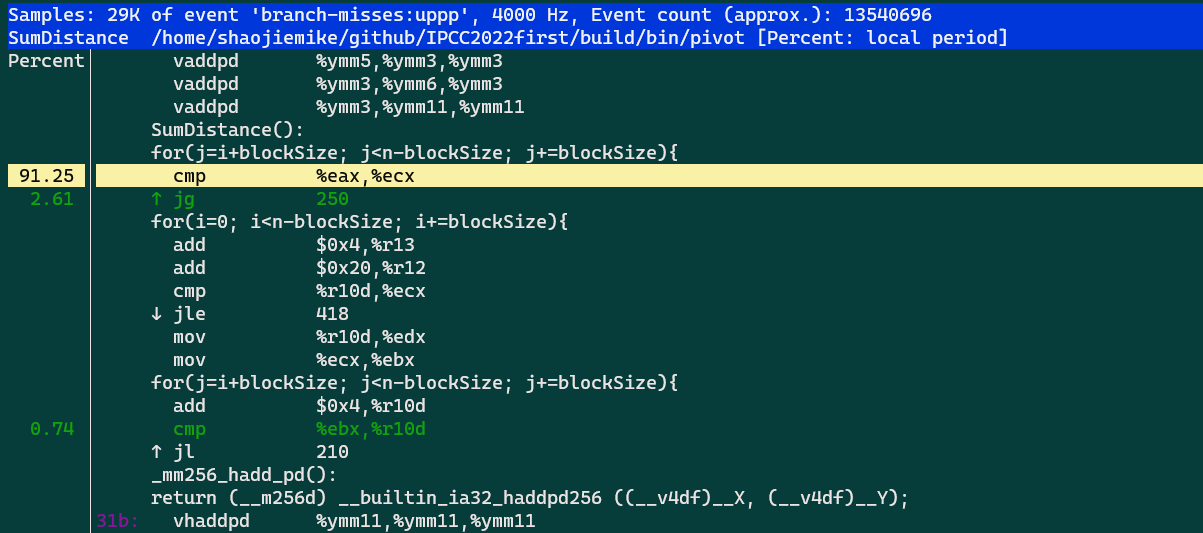
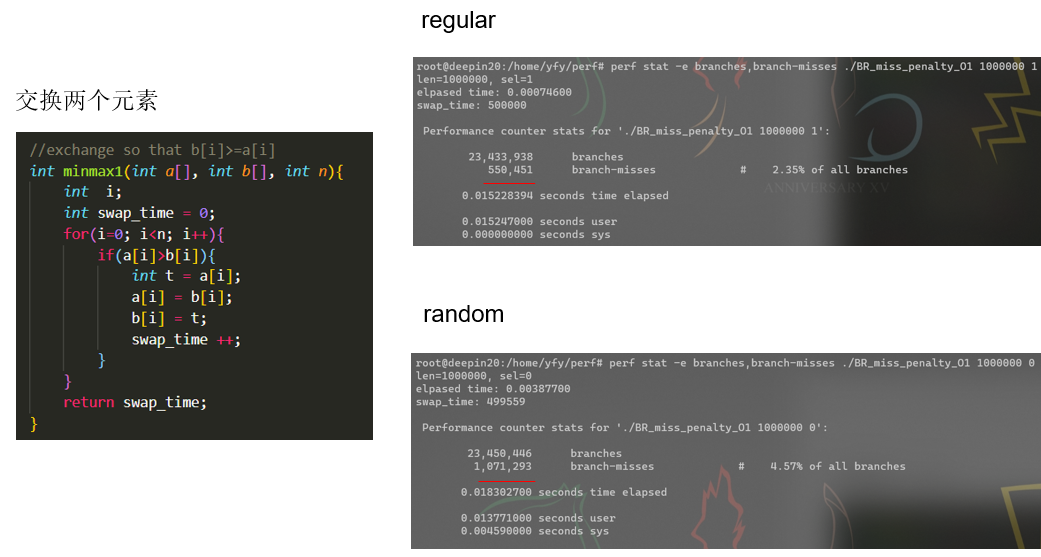
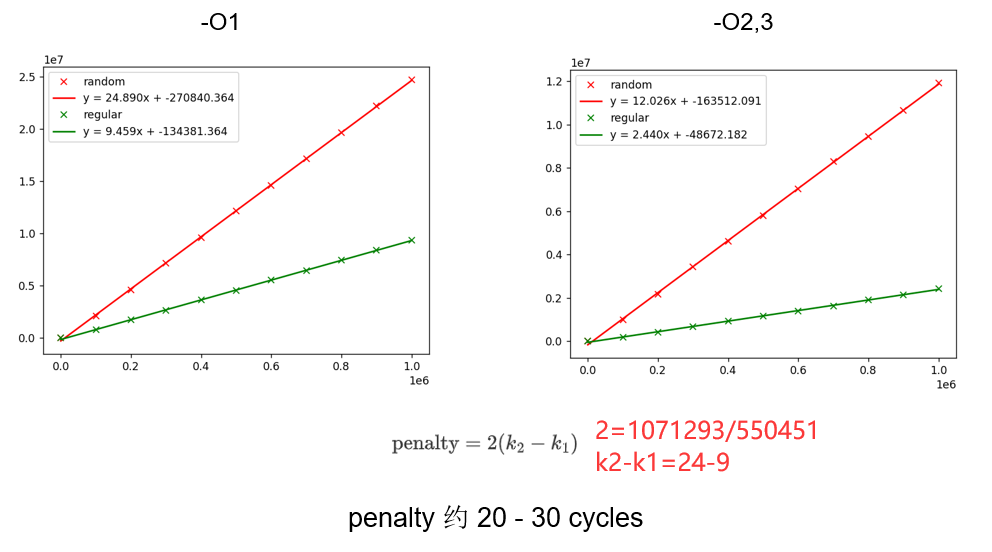
Perf stat例子: 通过CPE估计分支预测失败惩罚
实际例子
$ perf record -g ./bin/pivot "../run/uniformvector-2dim-5h.txt"
WARNING: Kernel address maps (/proc/{kallsyms,modules}) are restricted,
check /proc/sys/kernel/kptr_restrict and /proc/sys/kernel/perf_event_paranoid.

Samples in kernel functions may not be resolved if a suitable vmlinux
file is not found in the buildid cache or in the vmlinux path.

Samples in kernel modules won't be resolved at all.

If some relocation was applied (e.g. kexec) symbols may be misresolved
even with a suitable vmlinux or kallsyms file.

Couldn't record kernel reference relocation symbol
Symbol resolution may be skewed if relocation was used (e.g. kexec).
Check /proc/kallsyms permission or run as root.
dim = 2, n = 500, k = 2
Using time : 240.525000 ms
max : 143 351 58880.823709
min : 83 226 21884.924801
[ perf record: Woken up 1 times to write data ]
[ perf record: Captured and wrote 2.794 MB perf.data (30470 samples) ]
在不改变 /proc/sys/kernel 的时候
$ sudo perf record ./bin/pivot "../run/uniformvector-2dim-5h.txt"
dim = 2, n = 500, k = 2
Using time : 389.349000 ms
max : 143 351 58880.823709
min : 83 226 21884.924801
[ perf record: Woken up 1 times to write data ]
[ perf record: Captured and wrote 1.909 MB perf.data (49424 samples) ]
超算使用perf分析
有时候由于架构不同超算不能使用vtune,
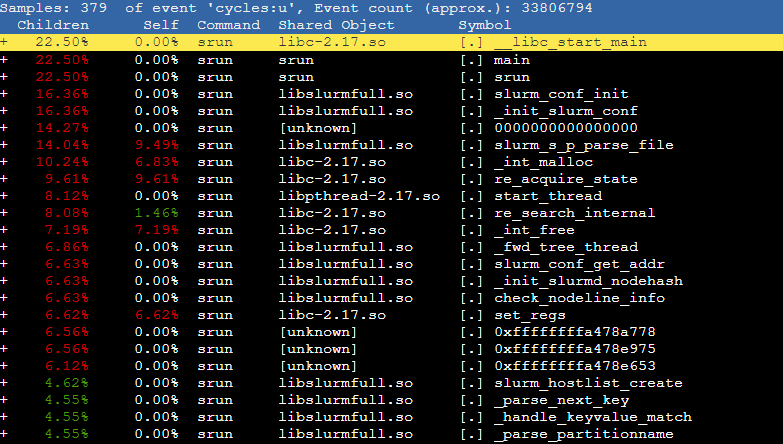
srun
没有生成perf.data文件。终端末尾输出一堆乱码,不懂(后面知道了乱码是因为没有指定 -o 输出,默认竟然输出到命令行)
申请bash然后运行一样结果
salloc
这样可以
ipcc22_0029@ln121 ~/github/MarchZnver1/IPCC2022-preliminary/run (main*) [07:38:46]
> salloc -p IPCC -N 1 -t 10:00
salloc: Granted job allocation 2175282
salloc: Waiting for resource configuration
salloc: Nodes fb0101 are ready for job
bash-4.2$ ls
check.py  manual.log  refer-2dim-5h.txt  refer-4dim-1h.txt  result.txt  run.2022-08-10.log  run_case1.sh  run-ipcc-mpi.sh  run-ipcc.sh  run-mpi.sh  run.sh  uniformvector-2dim-5h.txt  uniformvector-4dim-1h.txt
bash-4.2$ perf record -g ../build/bin/pivot uniformvector-4dim-1h.txt
但实际在登录节点跑的,有ssh不上去
sbatch
#!/bin/bash
#SBATCH -p IPCC
#SBATCH -t 3:00
#SBATCH --nodes=1
#SBATCH --exclude=
#SBATCH --cpus-per-task=64
#SBATCH --mail-type=FAIL
#SBATCH [email protected]

source /public1/soft/modules/module.sh
module purge

module load gcc/8.1.0
module load mpich/3.1.4-gcc8.1.0

logname=vtune
export OMP_PROC_BIND=close; export OMP_PLACES=cores
perf record -g -e task-clock:uppp /public1/home/ipcc22_0029/shaojiemike/github/IPCC2022-preliminary/build/bin/pivot /public1/home/ipcc22_0029/shaojiemike/slurm/uniformvector-4dim-1h.txt |tee ./$logname
返回
ipcc22_0029@ln121 ~/slurm  [11:18:06]
> cat slurm-2180072.out
Error:
task-clock:uppp: PMU Hardware doesn't support sampling/overflow-interrupts. Try 'perf stat'
修改指令为 perf record -g -o perfData -e task-clock:upp 支持 pp
分析CVT
感觉寄存器才用到10,还可以展开一次。
分析CVT变sub
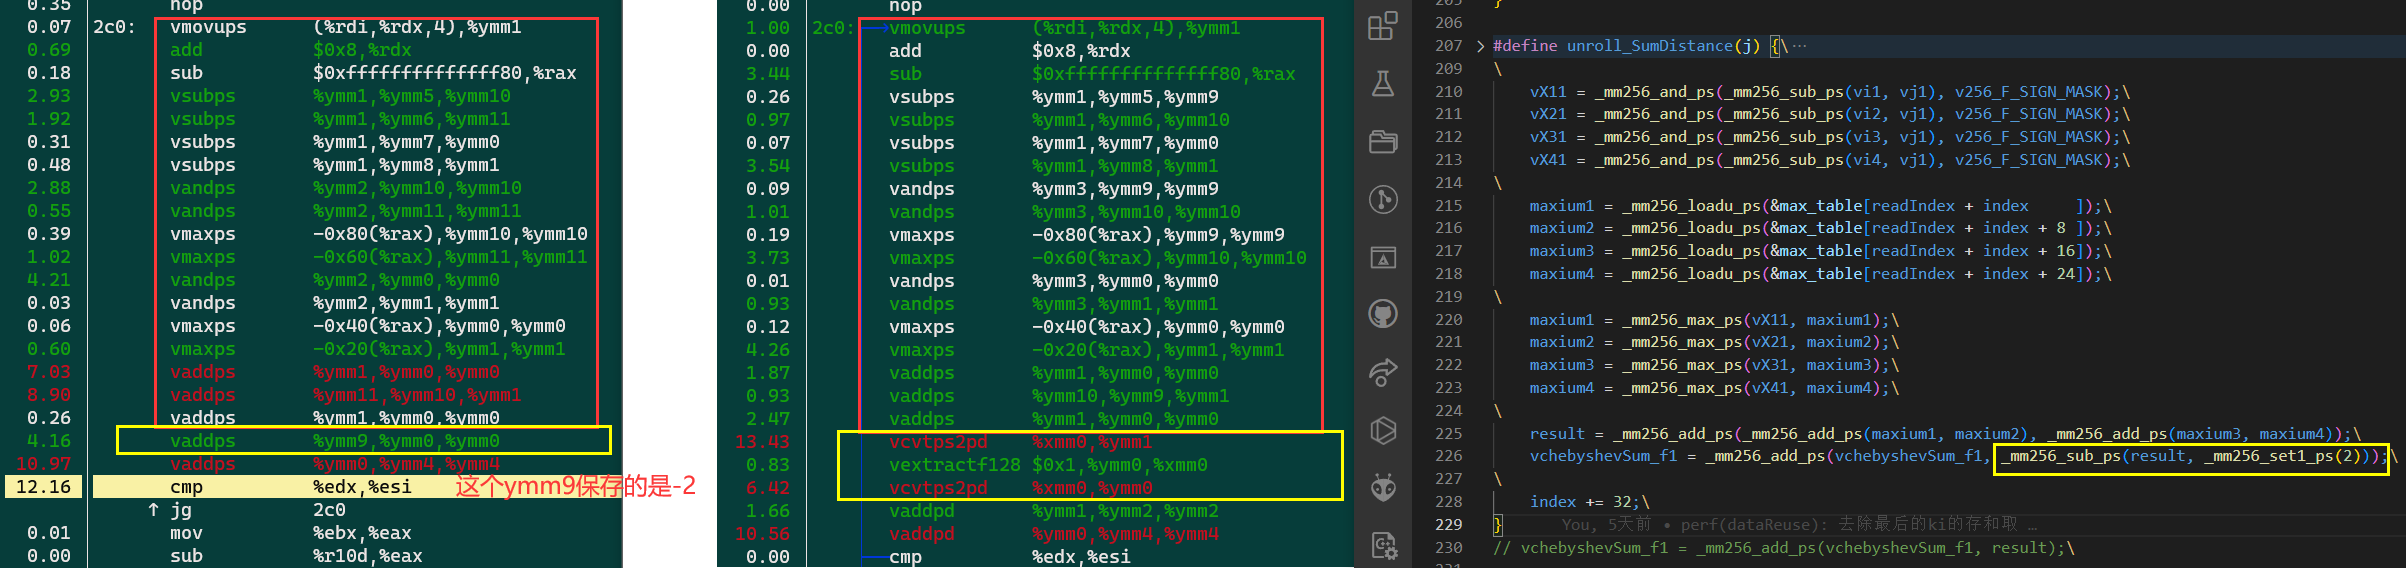
为了形成add流水,编译器把sub都改成add了。
vmovaps 0xf98(%rip),%ymm9 # 81a0 <blockSize+0x20> 应该是从静态变量里读的。
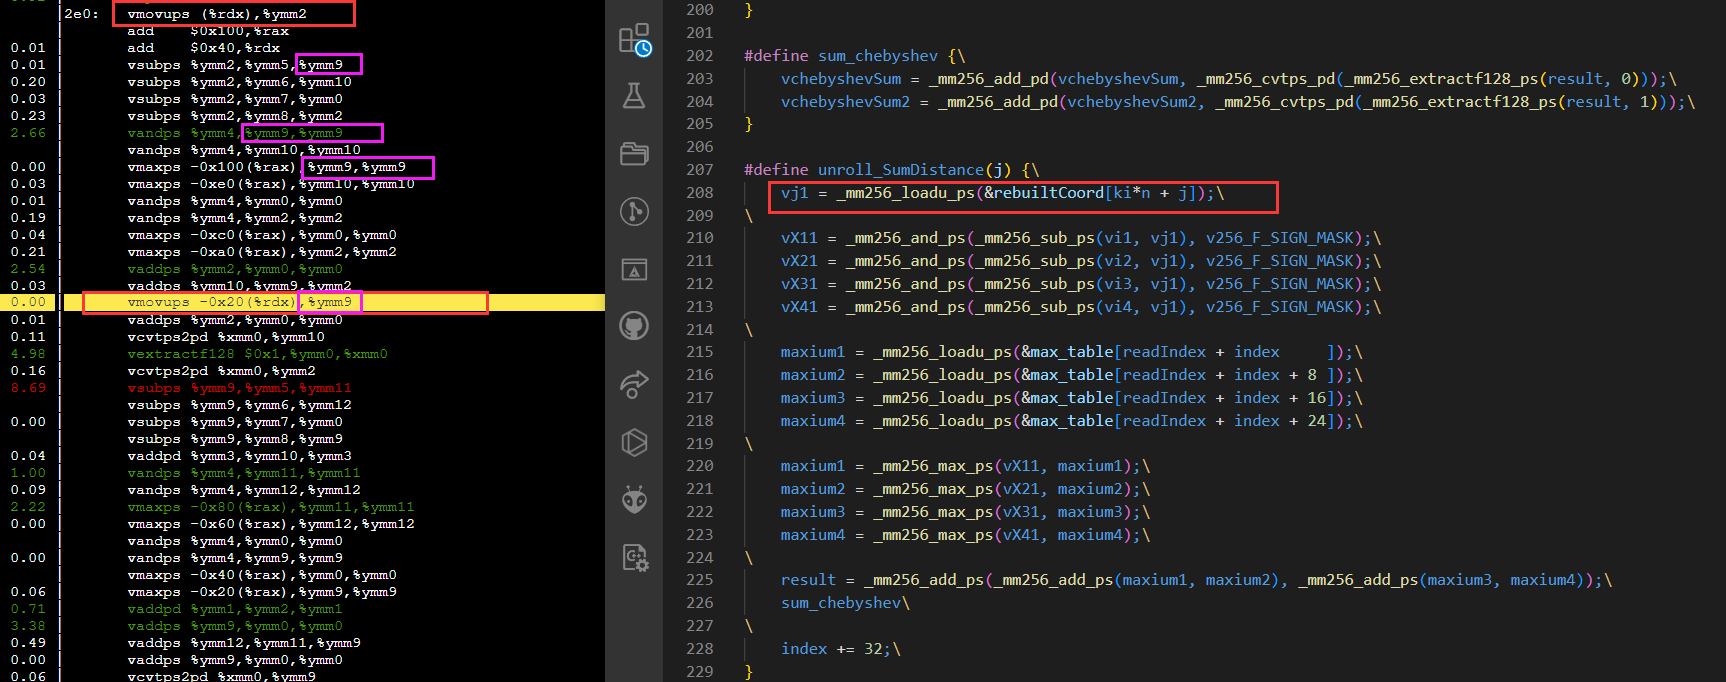
分析再展开一次float
 结果已经不对了,而且也没快(还是和资源流水有关吧,寄存器也吃紧了,sub都没在一起)
但是说明 unroll_SumDistance(j) 这种写法是能在汇编层面实现展开的
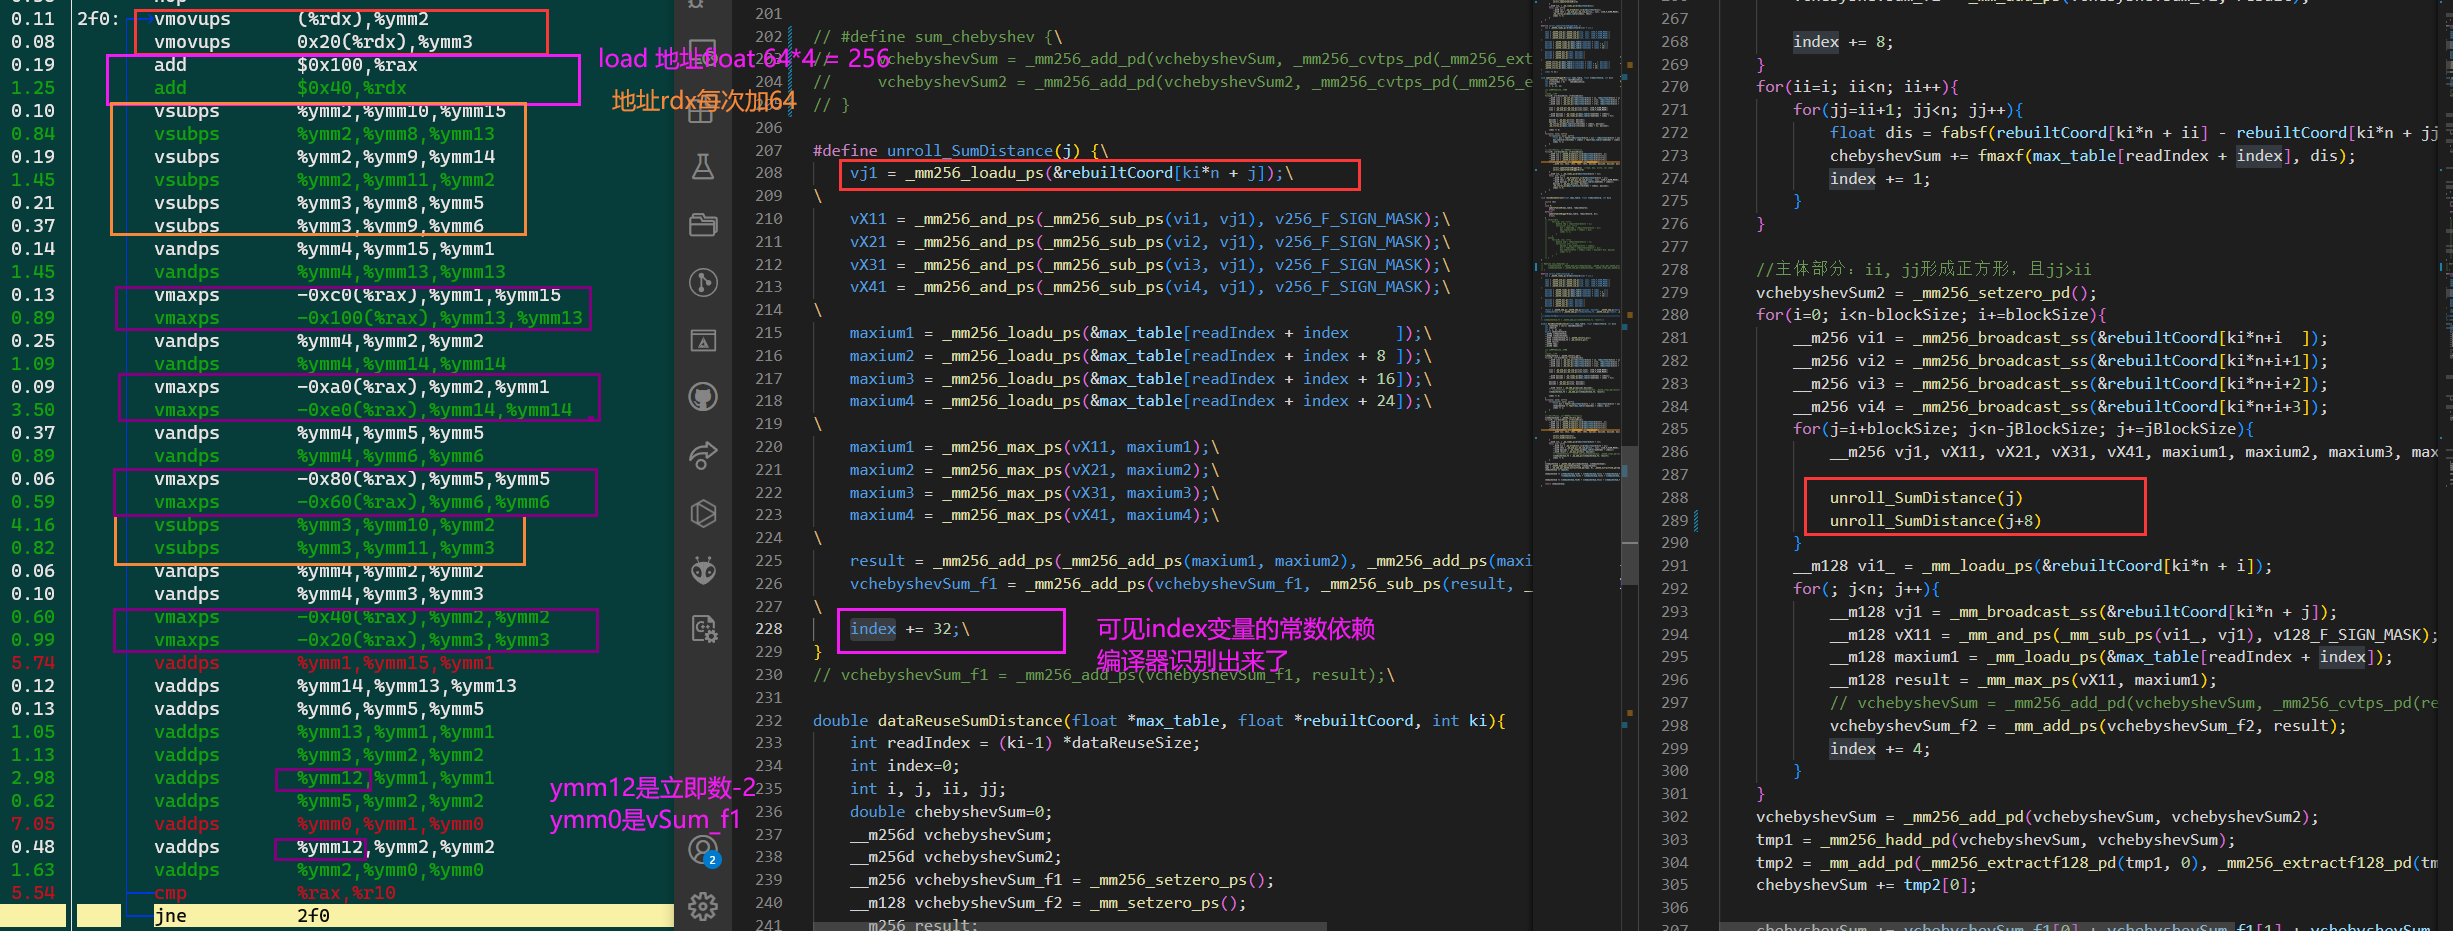
对比分析再展开一次double
由于寄存器更加紧张,load都不能再一起, ymm9 寄存器不够。
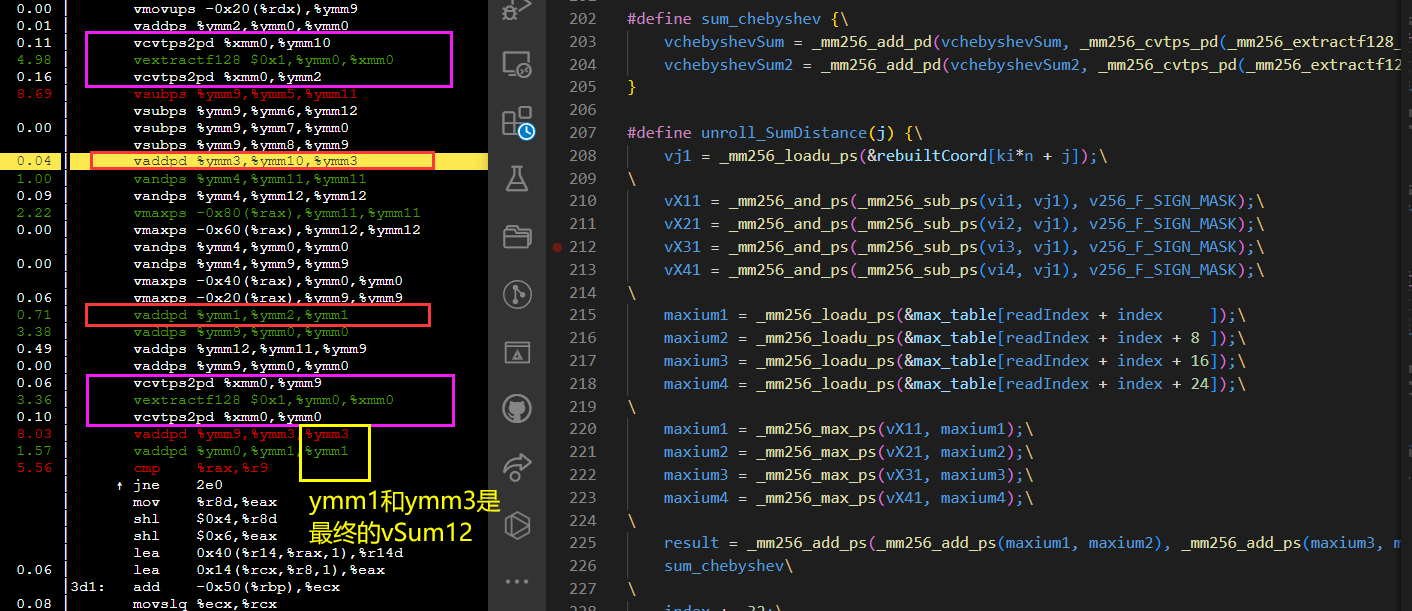 第一条红色的vadd感觉可以放下来。可能add和sub是公用同一个流水?
perf stat
单节点
 Performance counter stats for '/public1/home/ipcc22_0029/shaojiemike/github/IPCC2022-preliminary/build/bin/pivot /public1/home/ipcc22_0029/shaojiemike/slurm/case2/uniformvector-4dim-1h.txt':

         73,637.63 msec task-clock:u              #   54.327 CPUs utilized
                 0      context-switches:u        #    0.000 K/sec
                 0      cpu-migrations:u          #    0.000 K/sec
             9,433      page-faults:u             #    0.128 K/sec
   192,614,020,152      cycles:u                  #    2.616 GHz                      (83.34%)
     4,530,181,367      stalled-cycles-frontend:u #    2.35% frontend cycles idle     (83.32%)
    25,154,915,770      stalled-cycles-backend:u  #   13.06% backend cycles idle      (83.33%)
   698,720,546,628      instructions:u            #    3.63  insn per cycle
                                                  #    0.04  stalled cycles per insn  (83.34%)
    27,780,261,977      branches:u                #  377.256 M/sec                    (83.33%)
        11,900,773      branch-misses:u           #    0.04% of all branches          (83.33%)

       1.355446229 seconds time elapsed

      73.465281000 seconds user
       0.181156000 seconds sys
两个节点的perf数据感觉有问题, perf record 结果也很奇怪
Performance counter stats for 'mpirun -n 2 /public1/home/ipcc22_0029/shaojiemike/github/IPCC2022-preliminary/build/bin/pivot /public1/home/ipcc22_0029/shaojiemike/slurm/case2/uniformvector-4dim-1h.txt':

             51.37 msec task-clock:u              #    0.060 CPUs utilized
                 0      context-switches:u        #    0.000 K/sec
                 0      cpu-migrations:u          #    0.000 K/sec
             2,278      page-faults:u             #    0.044 M/sec
        39,972,793      cycles:u                  #    0.778 GHz                      (84.56%)
         2,747,434      stalled-cycles-frontend:u #    6.87% frontend cycles idle     (85.16%)
        10,620,259      stalled-cycles-backend:u  #   26.57% backend cycles idle      (88.39%)
        58,479,982      instructions:u            #    1.46  insn per cycle
                                                  #    0.18  stalled cycles per insn  (89.18%)
        14,068,620      branches:u                #  273.884 M/sec                    (77.31%)
           365,530      branch-misses:u           #    2.60% of all branches          (75.40%)

       0.850258803 seconds time elapsed

       0.015115000 seconds user
       0.038139000 seconds sys
具体分析例子
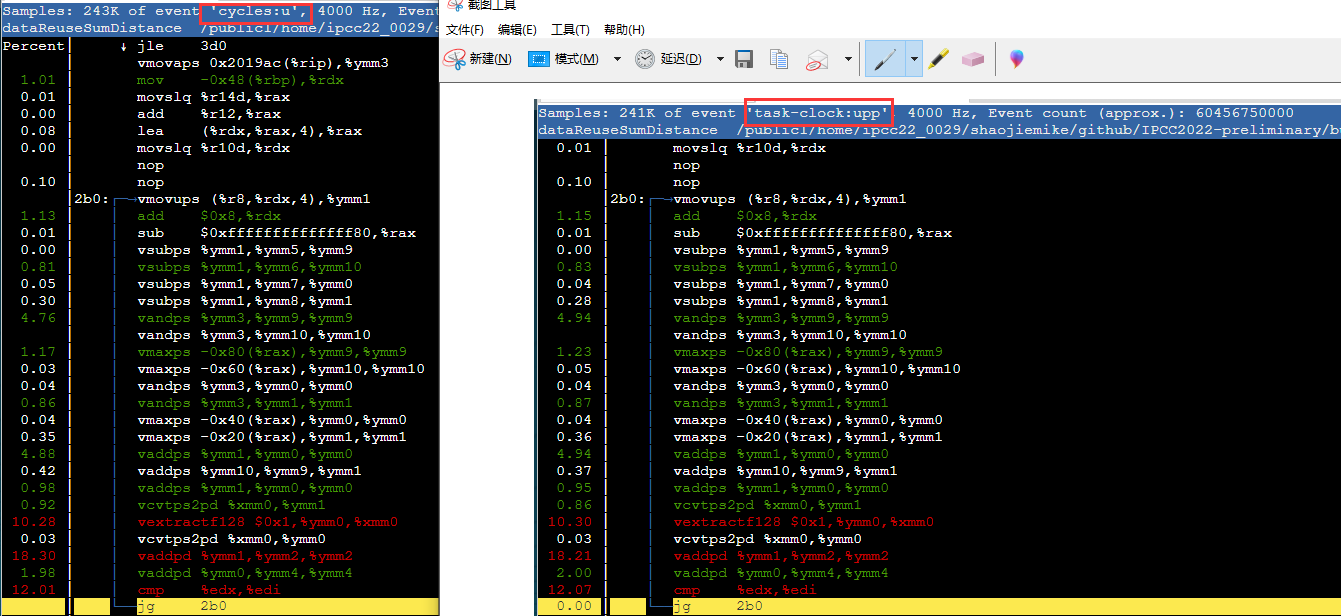
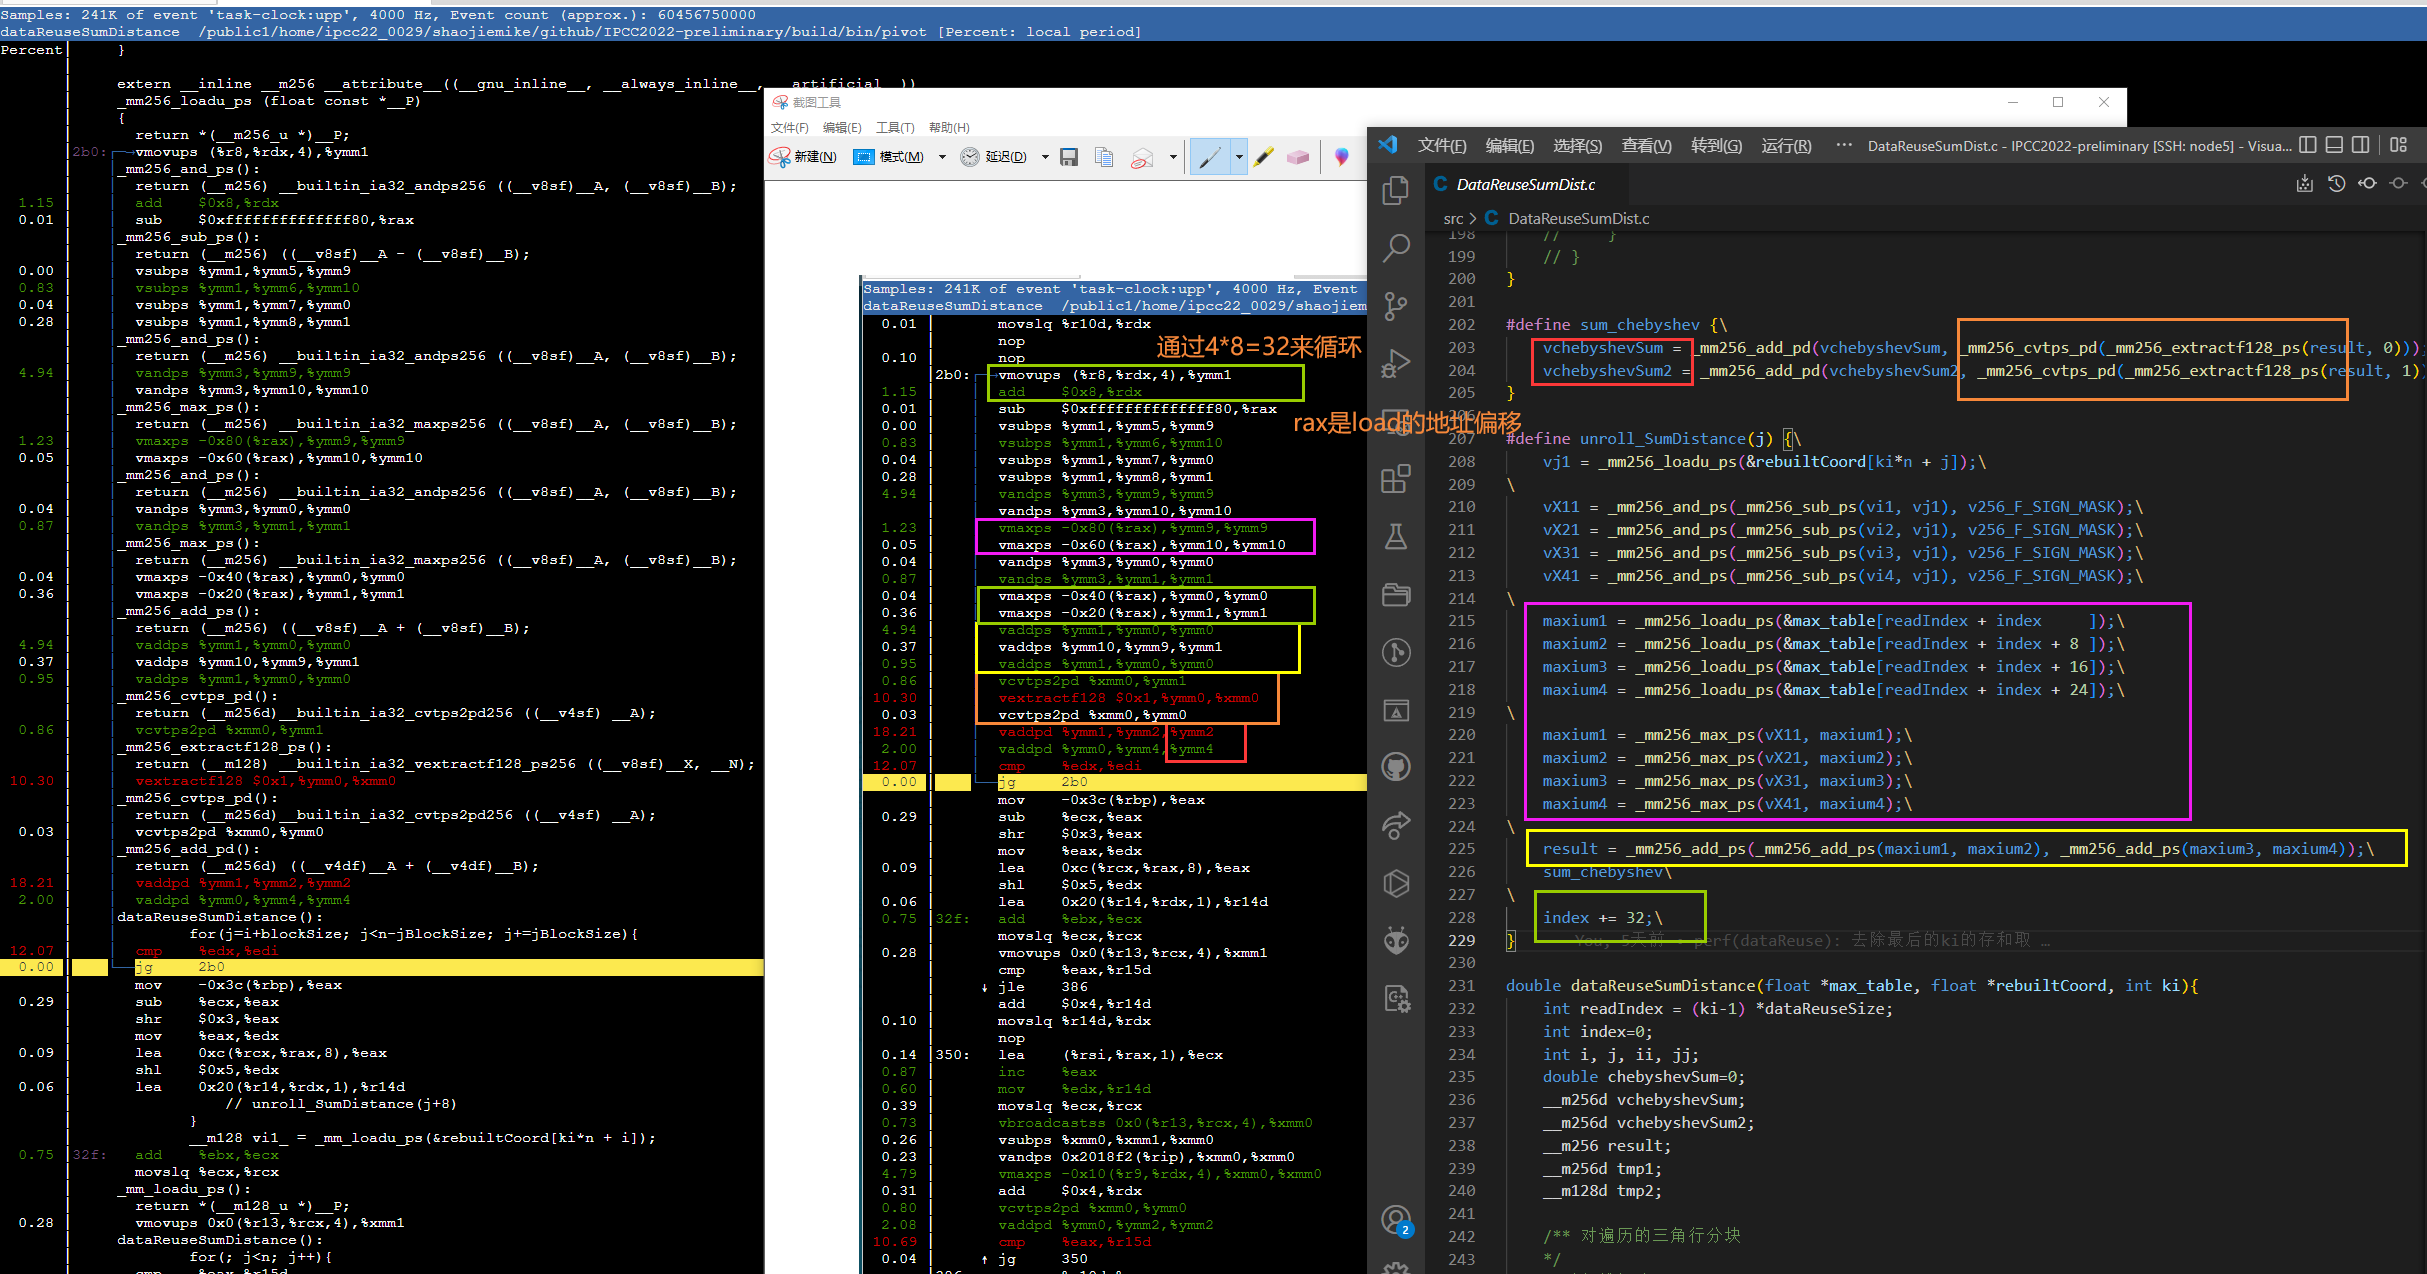
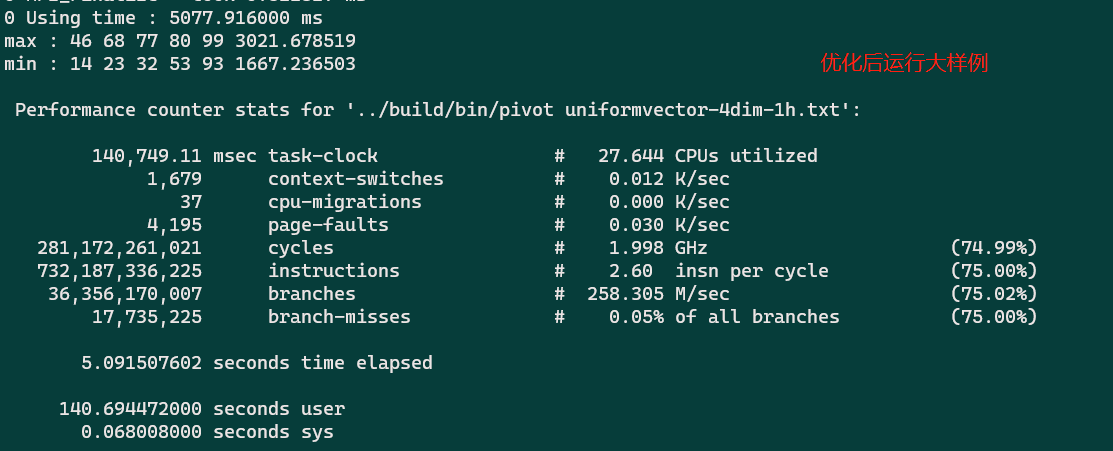
对于精心展开的手动向量化代码(理应用满了avx2的16个YMM*寄存器)
但是 -march=znver1 还是有1/3的加速。
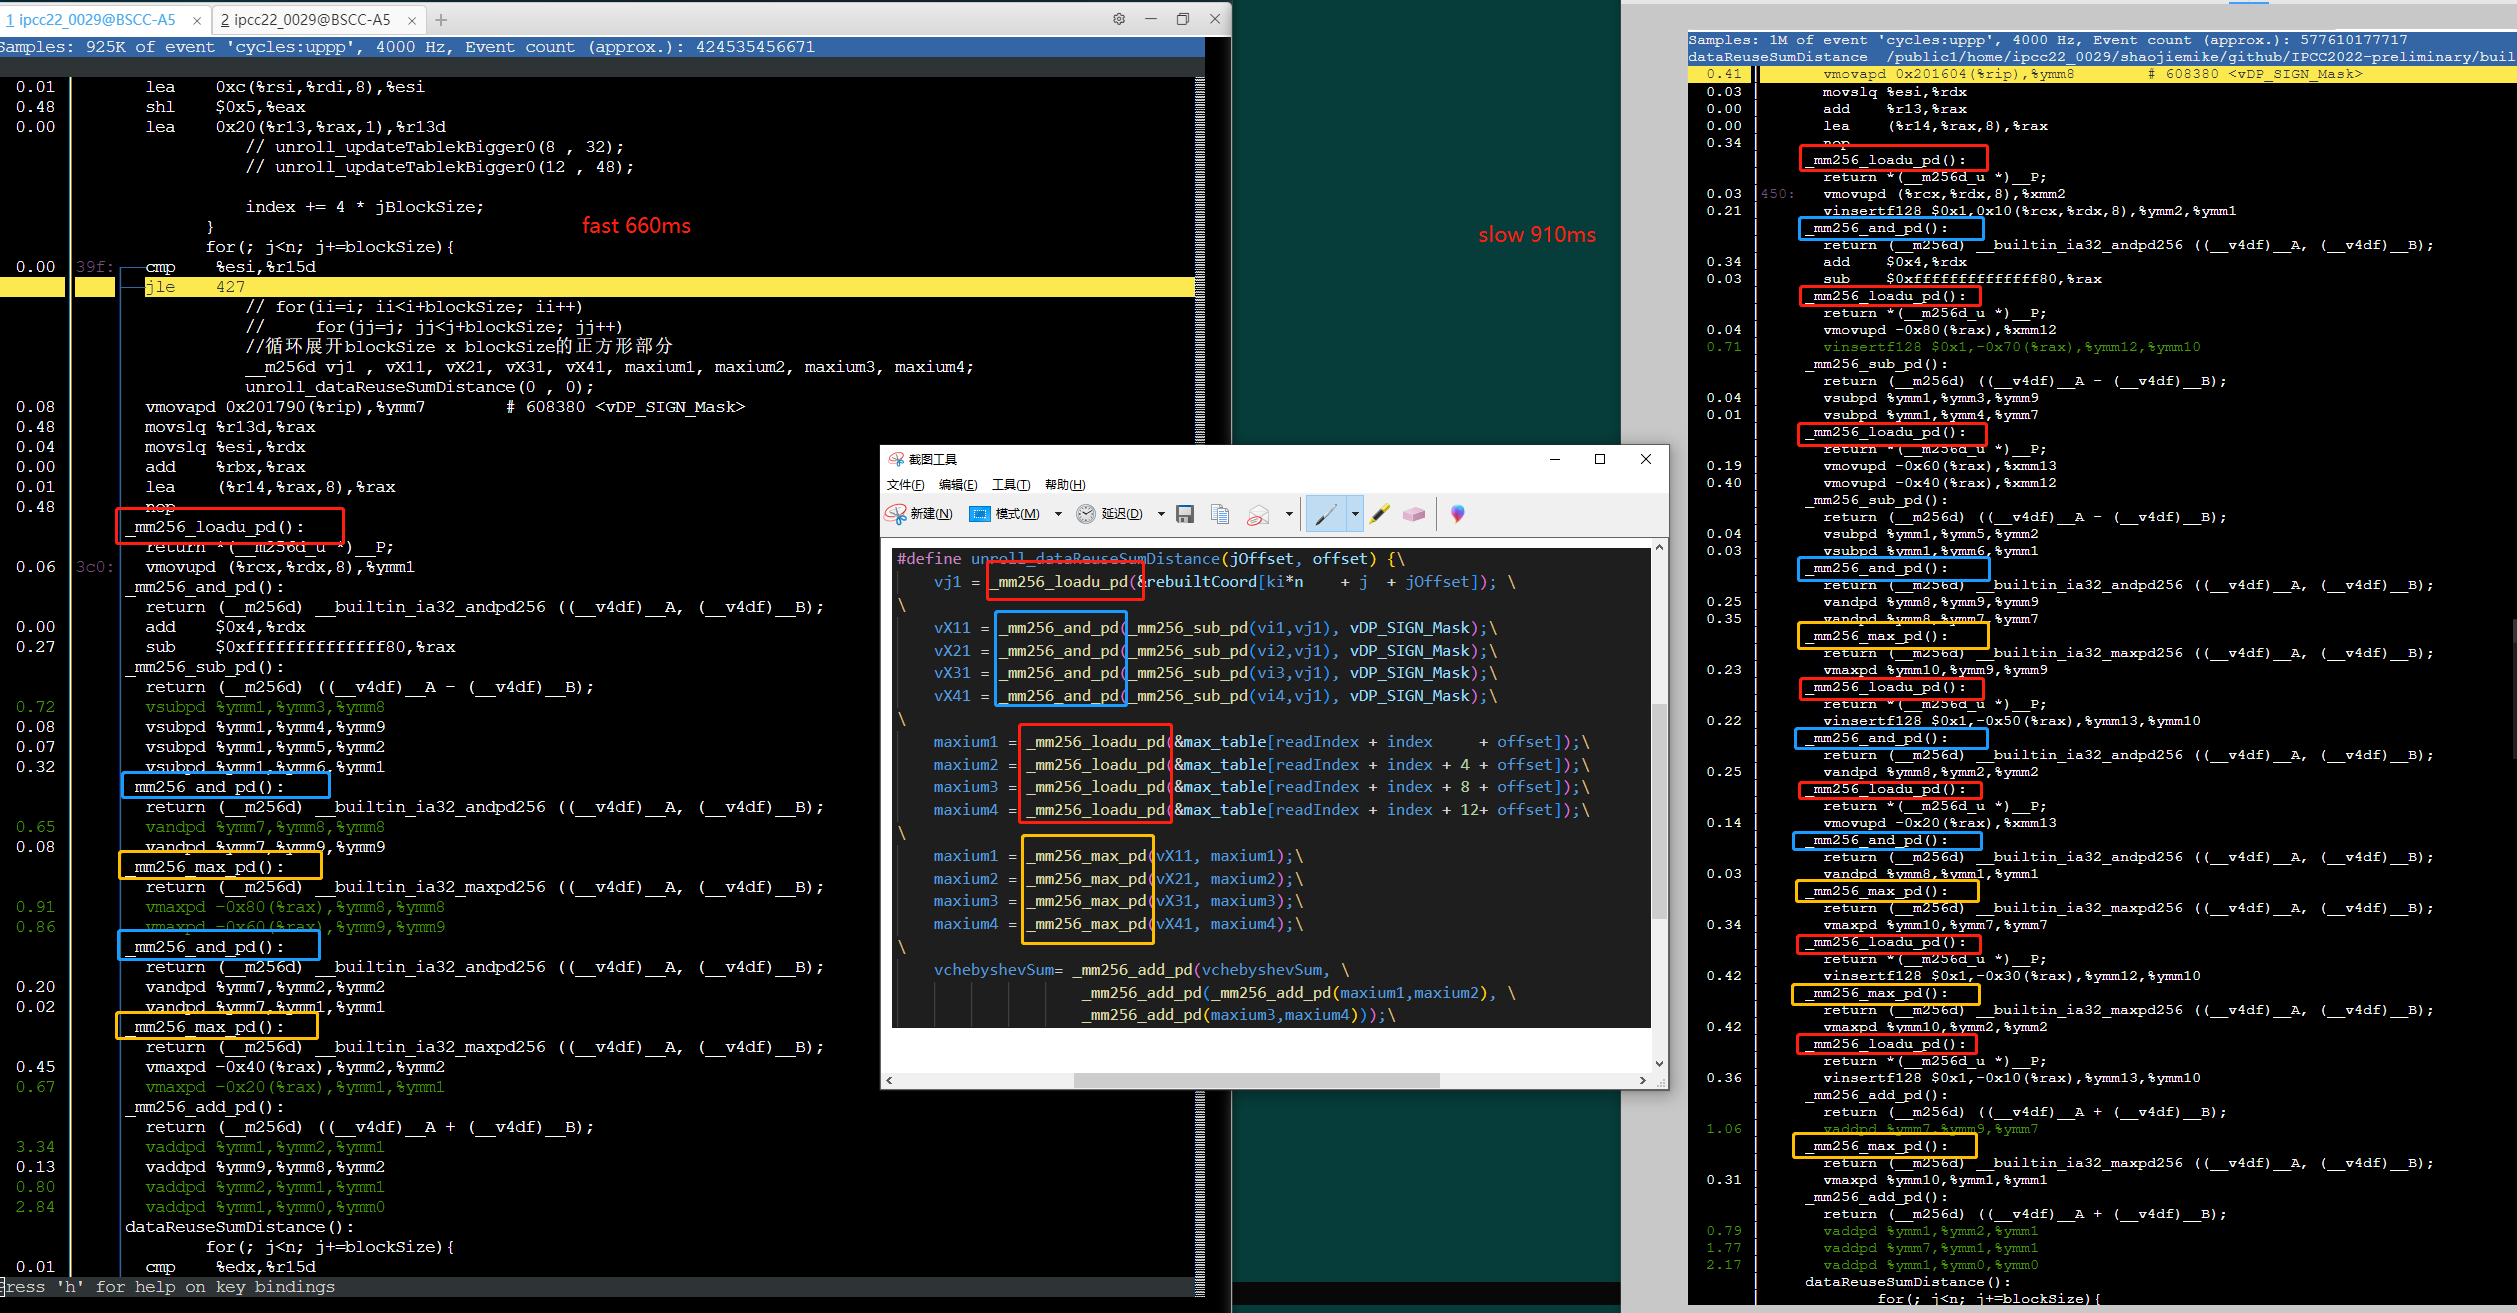
可以发现变快的代码几点区别(可能和相同类型指令在一起执行,没什么关系)
1. load的形式变了,没有采用了insertf128。(0.71 下降到 0.06)
2. load的次数变少了(vmaxpd 地址元素实现,减少指令数)
3. 指令没有被拆分的那么散,更紧凑了。
下面是核心展开两次的代码:
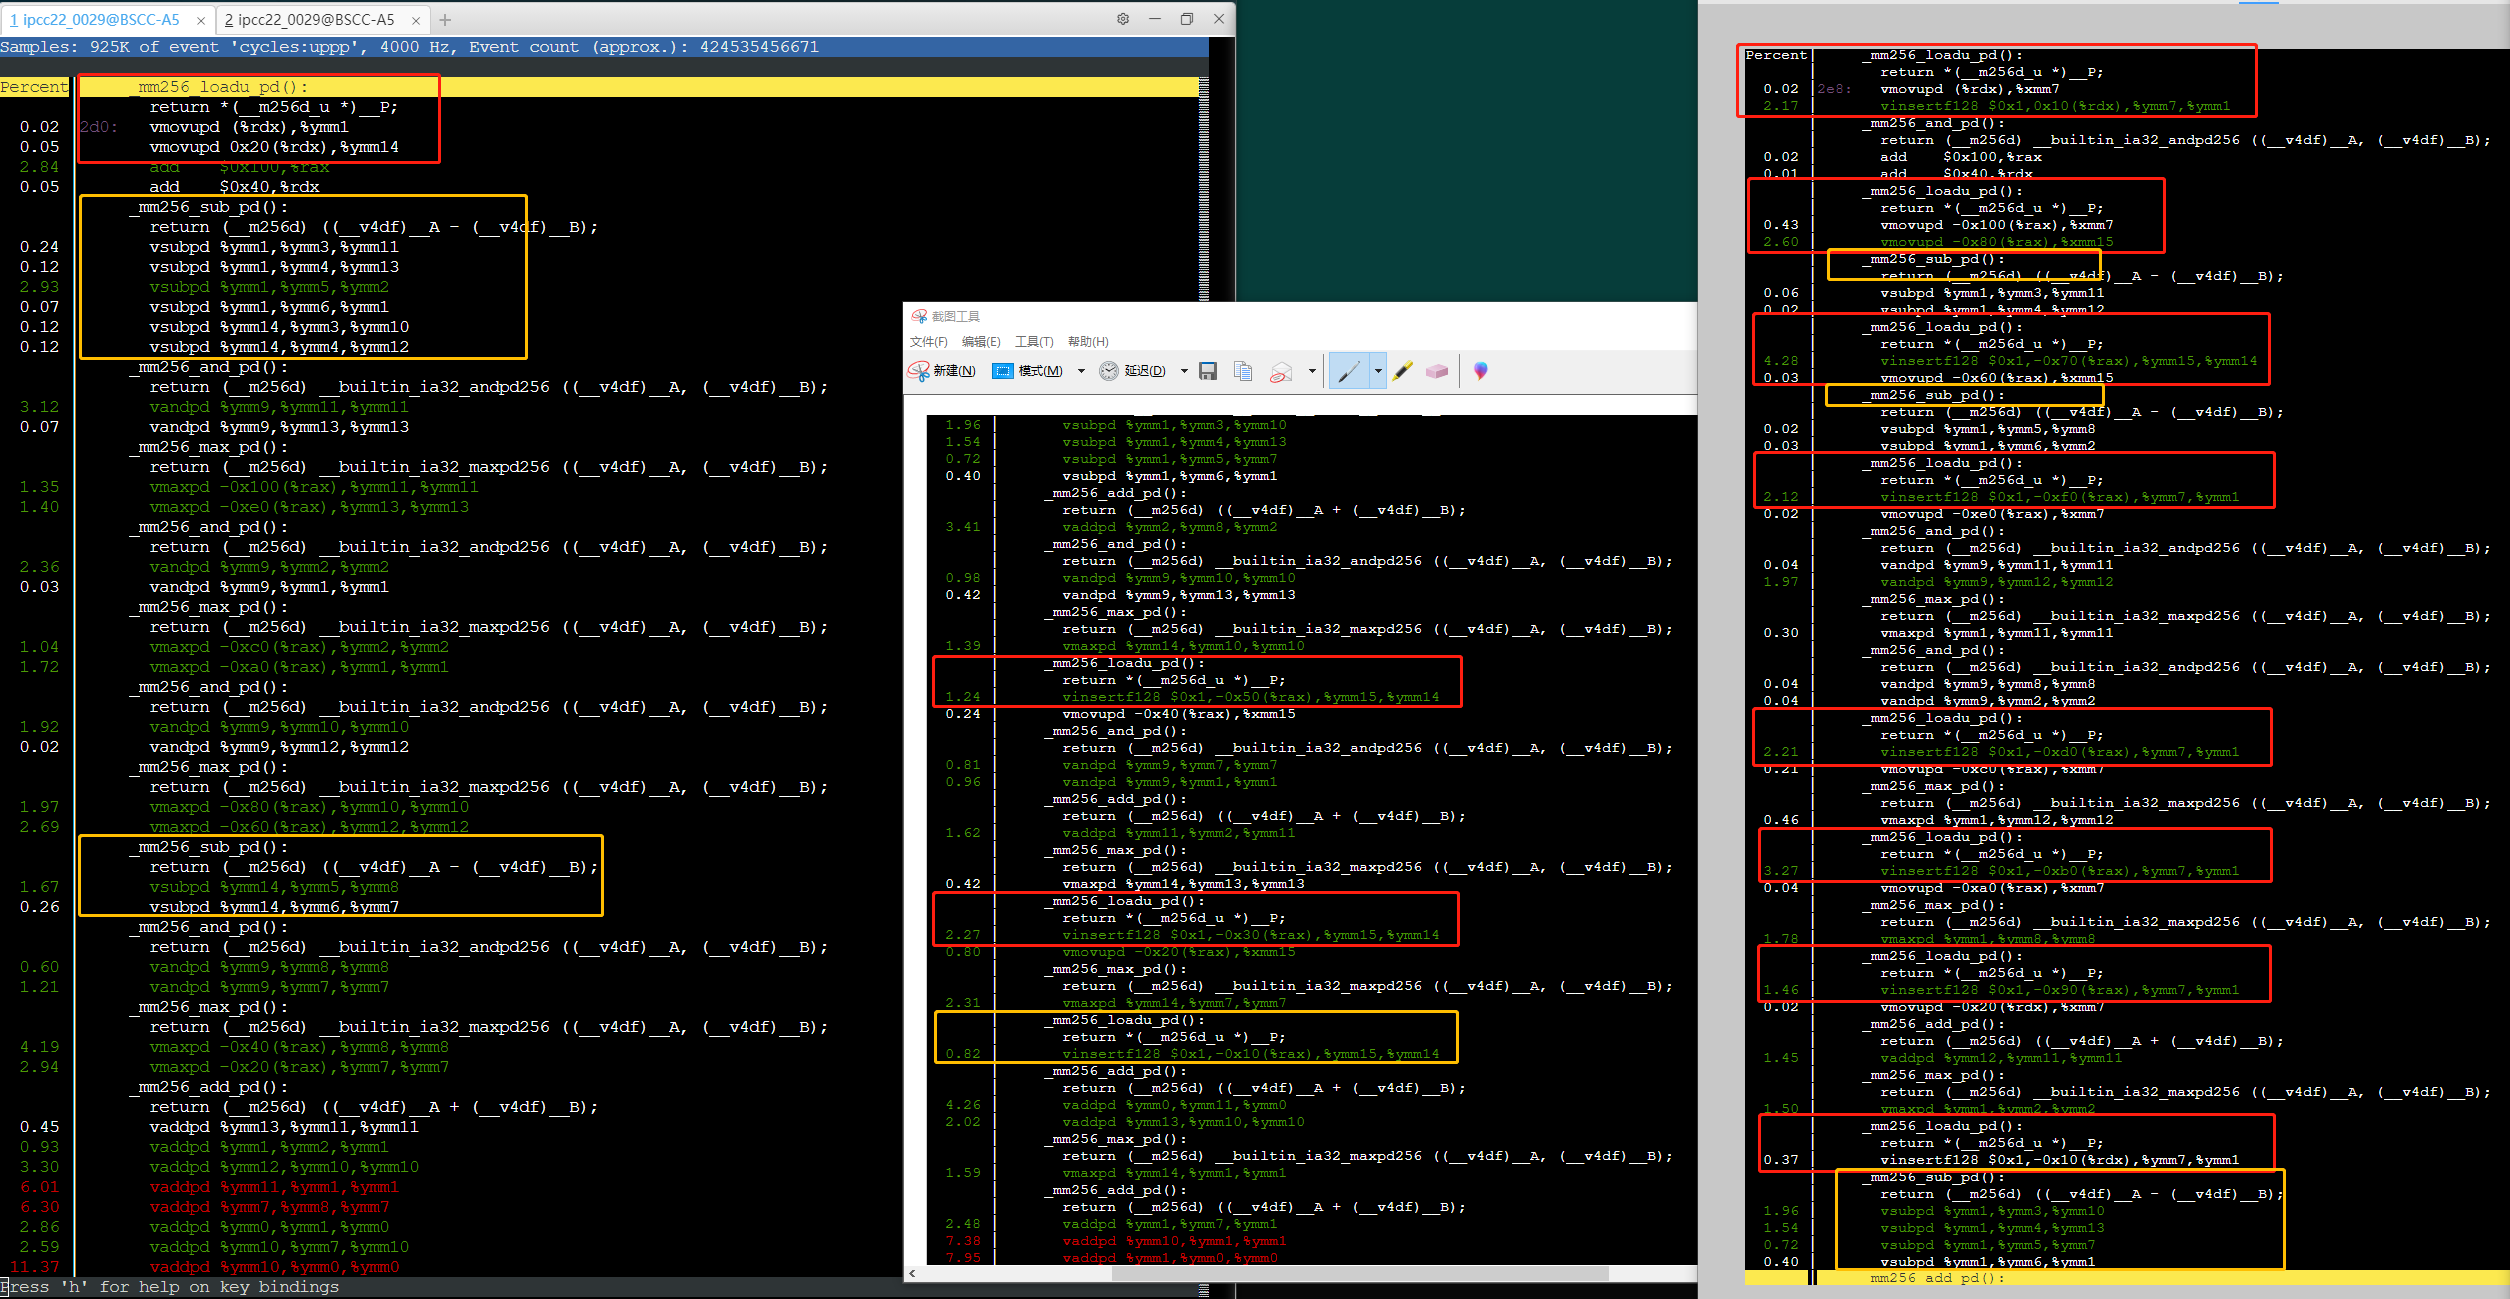 快速的代码
1. load统一load快?而且在循环外围load,,无需load(vmax地址元素实现)
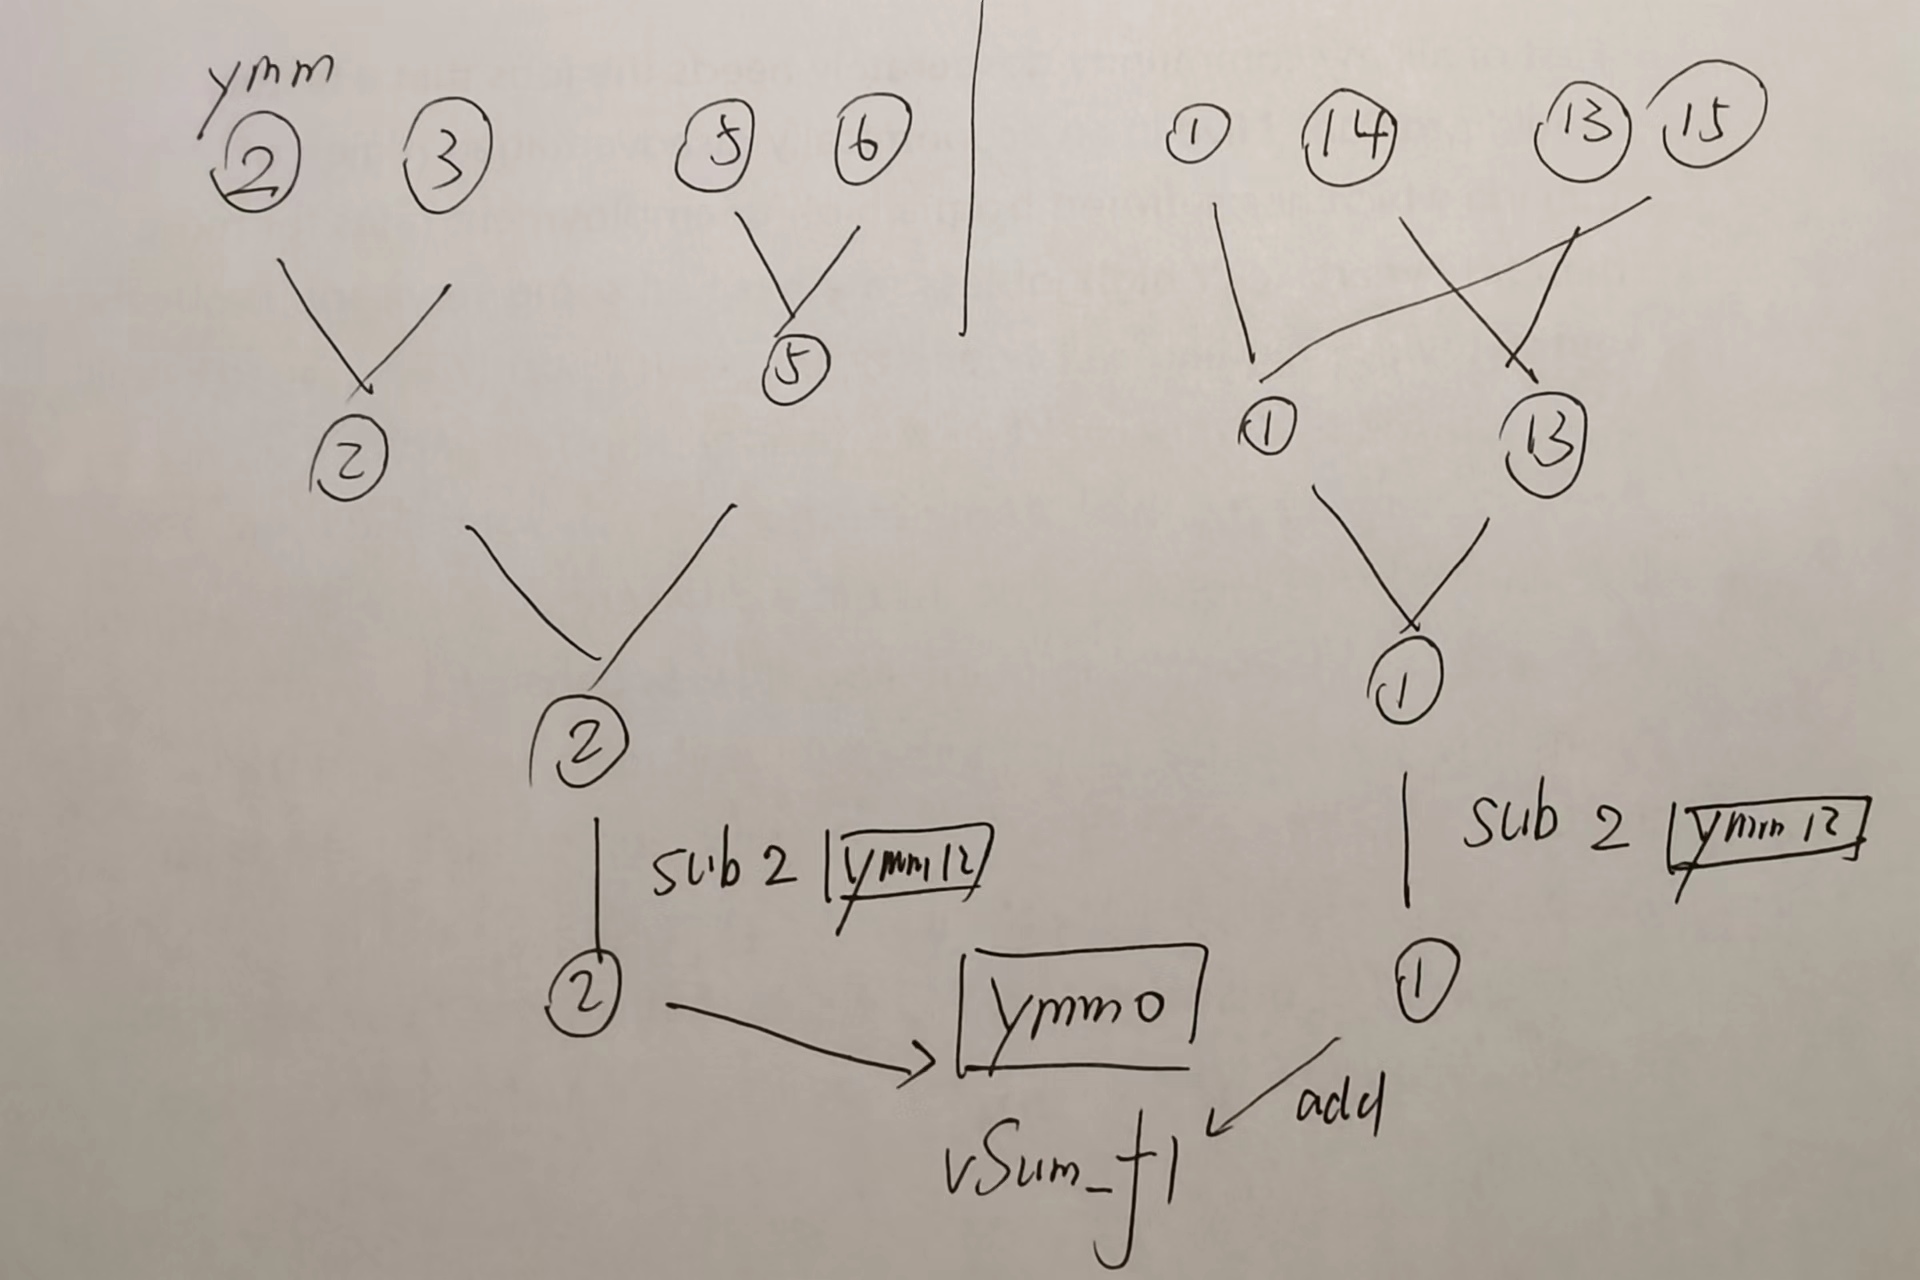
2. 从sub指令可以看出,是编译器是很想一起load,但是只有16个.(ymm0是总和,ymm9是掩码
快速的代码
1. load统一load快?而且在循环外围load,,无需load(vmax地址元素实现)
2. 从sub指令可以看出,是编译器是很想一起load,但是只有16个.(ymm0是总和,ymm9是掩码
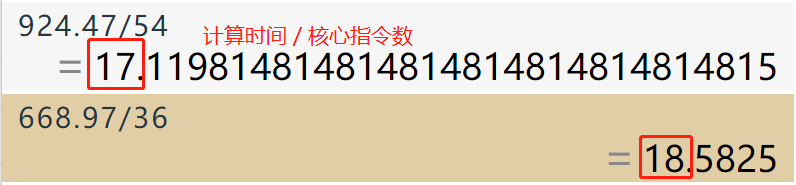
综合来看指令数减少了许多(看截图,快的36条指令, 慢的54条指令)。性能瓶颈在指令退休??
 可以perf stat来验证
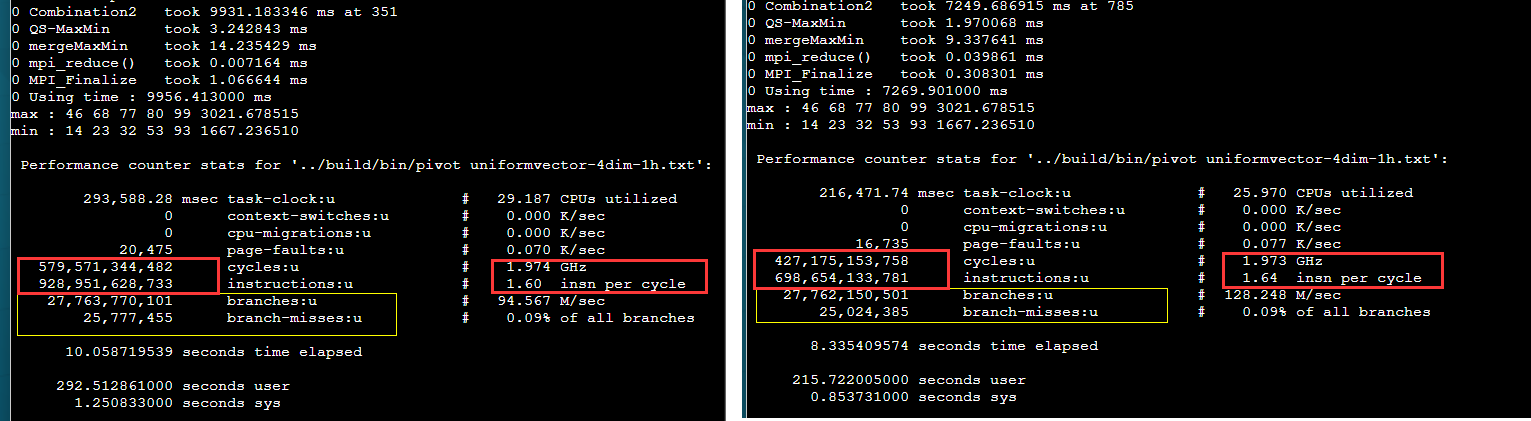 可以看出IPC基本没变。
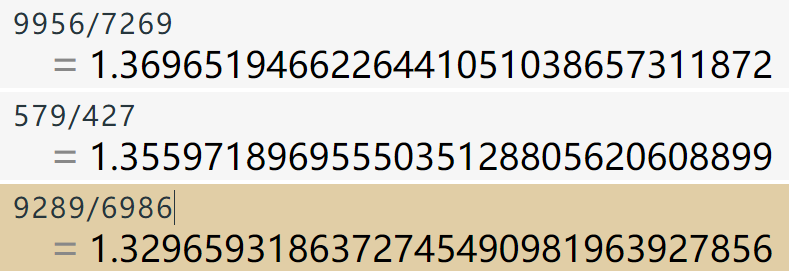
这样就可以解释为什么数据重用加上 -march=znver1 变快了,但是原本的没变快。因为数据重用多了n*n的许多的数据读取,然后该选项合并消减了许多指令(直接隐含到vmaxpd里了),所以有加速。但是原本的实现基本没有数据读取,自然没得优化,所以基本没加速。
机器的IPC影响因素
可以看出优化了有些许变化,主要原因是不同指令的Throughput不同(每个周期能执行的指令数)。
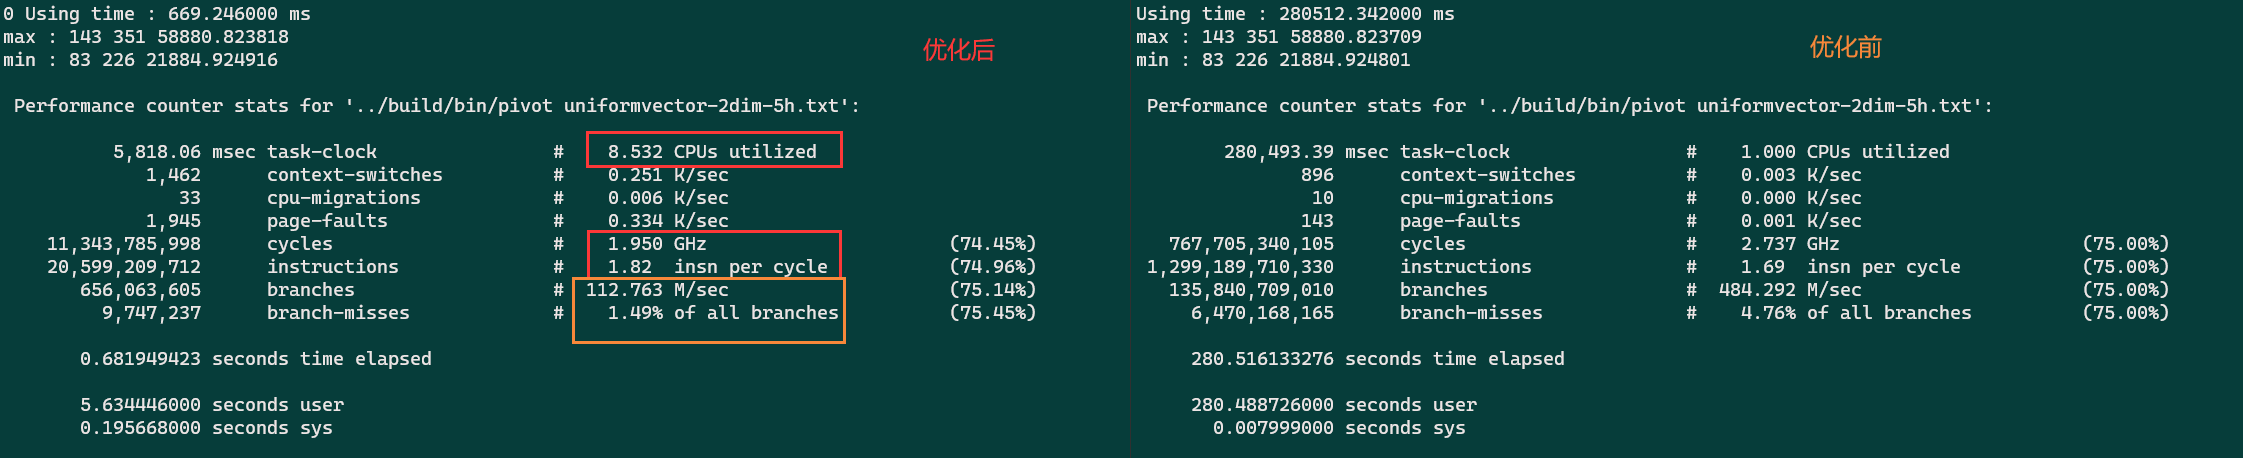 核数竟然就是
 userTime/elapsedTime 这也太粗暴了吧。
运行不同的例子,执行的程序内代码的权重和类型不同,IPC有所不同。(小例子有400/600的时间都在MPI_Init, 自然IPC会低一些)
常见问题
限制选项
perf_event_paranoid setting is 4:
  -1: Allow use of (almost) all events by all users
      Ignore mlock limit after perf_event_mlock_kb without CAP_IPC_LOCK
>= 0: Disallow raw and ftrace function tracepoint access
>= 1: Disallow CPU event access
>= 2: Disallow kernel profiling
编辑 /etc/sysctl.conf 文件,加入
kernel.perf_event_paranoid = -1
保存文件并退出。然后,你可以通过重新加载 sysctl 配置来使设置生效:
sudo sysctl -p
需要进一步的研究学习
暂无
遇到的问题
暂无
开题缘由、总结、反思、吐槽~~
参考文献
实验室同学袁福焱组会汇报
https://zhuanlan.zhihu.com/p/141694060