State Owned Enterprise
导言
听师兄说国企里相对有钱点的是邮储,电网和烟草。来研究一波
导言
听师兄说国企里相对有钱点的是邮储,电网和烟草。来研究一波
导言
每当到了人生的重要的十字路口的时候,人们总会思考想将自己的人生画成什么样子。高考完选志愿,本科毕业时是保研出国还是工作的路口时,我都觉得我对自己,对这个世界不够了解,把这个问题跳过了。但是研究生要毕业了,我总算想清楚了What i want。(虽然有点晚了,但至少我没有骗自己。
导言
Follow学术大牛, 和阅读前沿技术博客 是科研探索的乐趣所在。
导言
项目展望与机遇小结
| en | cn |
|---|---|
| Knowledgeable | 知己知彼 Be Skeptical |
| Independent | 自己拥有研究 |
| Smart | 透过观象看本质 |
| Soft | 三人行必有我师 |
科研,我们需要关注什么?
做项目的时候,一定要有测试程序跑,才能正向反馈。提高积极性,明确方向。
读论文,要多篇,提炼overview 抓住立足点,创新点和展望
侧重于测量方法的研究, 给出了并发存储的测量方法和尺度。
在 APC 中, 周期是存储活动周期 (memory active cycle), 不是通用的 CPU 周期,所以 APC 也叫 APMAC( 存储活动周期平均访问数, access per memory active cycle)。
同时 APC 采用重叠 (overlapping) 的访存时间统计方法 : 在有两个或多个存储访 问同时进行时, 周期只增加一次。
HPLinpack benchmark input file
Innovative Computing Laboratory, University of Tennessee
HPL.out      output file name (if any) 输出文件名
6            device out (6=stdout,7=stderr,file)

1            # of problems sizes (N) = sqrt((Memory Size in Gbytes * 1024 * 1024 * 1024) /8) * ratio
11136         Ns 矩阵规模

1            # of NBs block sizes (64~512)In the [96,104,112,120,128, …, 256] range; the multiple of 64
96           NBs 矩阵分块方法

0            PMAP process mapping (0=Row-,1=Column-major) 选择处理器阵列是按列的排列方式还是按行的排列方式。

1            # of process grids (P x Q)
2            Ps # two-dimensional block-cyclic data distribution = amount of processes; P≤Q
2            Qs 二维处理器网格(P×Q)

16.0         threshold 阈值

1            # of panel fact # 后面是L分解的方式
2            PFACTs (0=left, 1=Crout, 2=Right)
1            # of recursive stopping criterium
4            NBMINs (>= 1)
1            # of panels in recursion
2            NDIVs
1            # of recursive panel fact.
1            RFACTs (0=left, 1=Crout, 2=Right)
1            # of broadcast
1            BCASTs (0=1rg,1=1rM,2=2rg,3=2rM,4=Lng,5=LnM)
1            # of lookahead depth
1            DEPTHs (>=0)
2            SWAP (0=bin-exch,1=long,2=mix)
64           swapping threshold
0            L1 in (0=transposed,1=no-transposed) form
0            U  in (0=transposed,1=no-transposed) form
1            Equilibration (0=no,1=yes)
8            memory alignment in double (> 0)
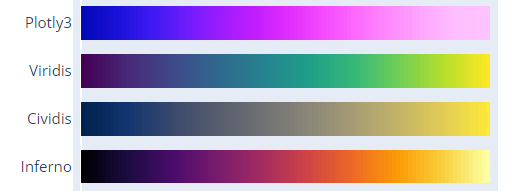
https://plotly.com/python/builtin-colorscales/
same in matplotlib
使用Dash: A web application framework for your data., 默认部署在localhost:8050端口
本地机器打通ssh隧道
In scientific research plotting, it's always bar charts instead of line charts.
Possible reasons:
font things, Attention, global settings have higher priority to get work
matplotlib.rcParams.update({
    "pgf.texsystem": "pdflatex",
    'font.family': 'serif',
    # 'text.usetex': True, # comment to support bold font in legend, and font will be bolder
    # 'pgf.rcfonts': False,
})
# mpl
fig.set_size_inches(w= 0.5 * x_count * (group_count+1.5), h=5.75 * 0.8) #(8, 6.5)

# plotly
fig.update_layout(height=350, width=50 * graph_data.size(),
                  margin=dict(b=10, t=10, l=20, r=5),
                  bargap=0.2 # x tick distance, 1 is the normalize-distance of adjacent bars
                  )
# mpl: Adjust the left margin to make room for the legend, left & right chart vertical line position from [0,1]
plt.subplots_adjust(left=0.1, right=0.8)
# mpl:
x = np.arange(len(graph_data.x))  # the label locations, [0, 1, 2, 3, 4, 5, 6, 7]
# set the bar move to arg1 with name arg2
ax.set_xticks(x + (group_count-1)*0.5*width, graph_data.x)
plt.xticks(fontsize=graph_data.fontsize+4)
# Adjust x-axis limits to narrow the gap
plt.xlim(-(0.5+gap_count)*width,
        x_count - 1 + (group_count-1)*width + (0.5+gap_count)*width)


# plotly
# mpl
ax.set_ylabel(yaxis_title,
              fontsize=graph_data.fontsize,
              fontweight='bold')
plt.grid(True, which='major',axis='y', zorder=-1.0) # line and bar seems need to set zorder=10 to cover it
plt.yticks(np.arange(0, max_y ,10), fontsize=graph_data.fontsize) # step 10
plt.yscale('log',base=10) # or plt.yscale('linear')
ax.set_ylim(0.1, max_y)
## highlight selected y-label: https://stackoverflow.com/questions/73597796/make-one-y-axis-label-bold-in-matplotlib

# plotly
fig.update_layout(
      yaxis_range=[0,maxY],
      yaxis=dict(
          rangemode='tozero',  # Set the y-axis rangemode to 'tozero'
          dtick=maxY/10,
          gridcolor='rgb(196, 196, 196)', # grey
          gridwidth=1,
      ),
)
# mpl ?

# plotly: Add a rectangle shape to cover the entire subplot area
fig.add_shape(type="rect",
            xref="paper", yref="paper",
            x0=0, y0=0,
            x1=1, y1=1,
            line=dict(color="black", width=0.7))
# mpl: Create a bar chart with bold outlines
plt.bar(categories, values, edgecolor='black', linewidth=2)

# plotly: ?
# mpl:
ax.legend(loc='upper left', ncols=3, fontsize=graph_data.fontsize)
# legend out-of-figure, (1.02, 1) means anchor is upper right corner
plt.legend(loc='upper left', bbox_to_anchor=(1.02, 1), borderaxespad=0)

# Calculate the legend width based on the figure width
fig_size = plt.gcf().get_size_inches()
fig_width = fig_size[0]
# Move the legend to the center above the ceiling line
plt.legend(loc='upper center', bbox_to_anchor=(0.5, 1.1),
  ncol=2,  # ncol=2 to have labels in one line
  frameon=False,  # frameon=False removes the legend box outline
  columnspacing=fig_width, # distance between each label
  handlelength=1.0, # label-box width (unit is text fontsize)
  handleheight=1.0, # label-box heigh (unit is text fontsize)
  prop={'size': 20, 'weight': 'bold'} # text fontsize
)
# mpl: white hugo hatch with black bar edge.
# Problem: because the bug of mpl. hatch color follow the edge color
# Solved: draw bar twice, first the white hugo hatch with white bar edge. Second empty figure with black bar edge.
# white doubel ref: https://stackoverflow.com/questions/38168948/how-to-decouple-hatch-and-edge-color-in-matplotlib
# ref2: https://stackoverflow.com/questions/71424924/how-to-change-the-edge-color-of-markers-patches-in-matplotlib-legend
color_palette = ['black', (193/255, 1/255, 1/255), 'w', (127/255, 126/255, 127/255), 'blue']
pattern_list = ["", "/", "+", "\\", "x"]
edgecolor_list = ['w', 'w', (0/255, 176/255, 80/255), 'w', 'w']

ax.bar(x + offset, measurement, width, label=species_name,
                       color=color_palette[idx],
                        hatch = pattern_list[idx],
                        edgecolor=edgecolor_list[idx],
                        linewidth=1,
                     )
ax.bar(x + offset, measurement, width, label=species_name,
            color = "none",
            edgecolor='black', linewidth=1,
              )
# related legend: https://stackoverflow.com/questions/71424924/how-to-change-the-edge-color-of-markers-patches-in-matplotlib-legend
handles1, labels1 = ax.get_legend_handles_labels()
plt.legend([handles1[2*idx]+handles1[2*idx+1] for idx in range(group_count)],
            [labels1[2*idx] for idx in range(group_count)],
            loc='upper center', bbox_to_anchor=(0.5, 1.12),
            ncol=group_count,  # have labels in one line
            frameon=False,
            # bbox_transform=plt.gcf().transFigure,
            columnspacing=legend_width,
            # handlelength=1.0,
            handleheight=1.2,
            prop={'size': graph_data.fontsize,
                'weight': 'heavy'}
)


# plotly: find the overflow
overflow_pattern = ["/" if y > maxY  else "" for y in entry[1]]
fig.add_bar(x=x,y=yList,
    name=barName,
    marker=dict(
        color=color_list[i],
        pattern_shape = overflow_pattern,
        line=dict(color='black', width=2)
        ),
    textfont=dict(size=graph_data.fontsize),
)
# legend
legend_num = len( barDict.items())
fig.update_layout(barmode="relative",

        # legend_title="Legend Title",
        legend = dict(
          entrywidthmode='fraction', # https://plotly.com/python/legend/
          entrywidth= 0.2,
          x=0.5 - 0.5 * legend_num * 0.2,        # Set x to 0.5 for the center
          y=1.2,       # Set y to a value greater than 1 to move it above the plot
          orientation="h",  # Display legend items in a single line
        ),
)
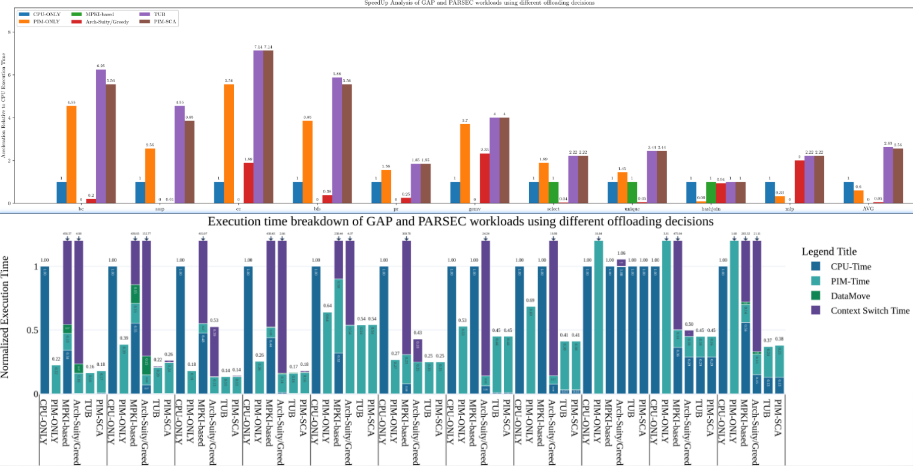
To draw symmetry chart, we need to special highlight the overflow bar number.
If the ancher point locate in the plot box, it's easy to show text above the ceil line using textposition="bottom" like option. In the opposite scenario, plotly and mathplotlib all will hide the out-box text.
# plotly
fig.add_annotation(
            x=[x[0][i],x[1][i]],  # 注释的 x 坐标为 "bc"
            y=min(maxY,entry),  # 注释的 y 坐标为该列的最大值
            text=f"{entry:.2f}",  # 注释的文本内容
            # valign = "bottom", # text position in text box(default invisible)
            yanchor = "bottom", # text box position relative to anchor
            showarrow=False,  # 显示箭头
            # bgcolor="rgba(255, 255, 255, 0.8)",  # 注释框背景颜色
            font=dict(size=graph_data.fontsize+2)  # 注释文本字体大小
        )

# mathplotlib
# Create labels for overflowed values
for i, value in enumerate(values):
    if value > maxY:
        ax.annotate(f'Overflow: {value:.2f}', (i, maxY), ha='center', va='bottom', fontsize=12)
But mlb can write text out box.
ax.text(1, -1.6, 'Increasing', ha="center")

# first parameter is text, xy is the anchor point, xytext is the text,
# xytext 2 xy is a relative distance
ax.annotate('yahaha', xy=(0, -0.1), xycoords='axes fraction', xytext=(1, -0.1))
mathplotlib(mpl) can achieve this using ref, but there are few blogs about plotly.
# mpl: from 1*1 size full-graph (0.5,0.2) to point (1,0.8)
# transform=gcf().transFigure : gcf() stands for "get current figure," and .transFigure indicates that the coordinates provided in [0.5, 0.5], [0, 1] are in figure-relative coordinates. This means that the line's position is defined relative to the entire figure, not just the axes
# clip_on=False : This setting means that the line is not clipped at the edges of the axes. It allows the line to extend beyond the axes' boundaries.
from pylab import *
plot([0.5, 1], [0.2, 0.8], color='lightgreen', linestyle='--', lw=1 ,transform=gcf().transFigure, clip_on=False)

# mpl: arrow from xy 2 xytext
# xycoords='figure fraction' to Add annotation to the figure (full graph)
ax.annotate('', xy=(0, -0.1), xycoords='axes fraction', xytext=(1, -0.1),\
arrowprops=dict(arrowstyle="->", color='violet'))
# mpl:
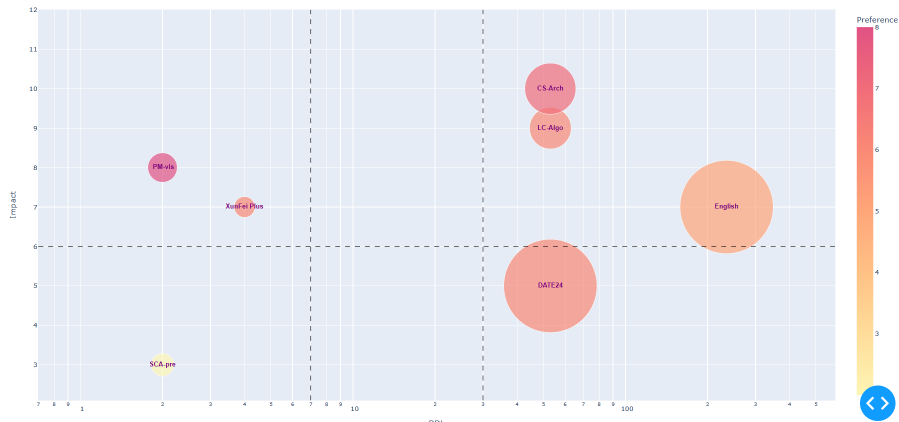
ax.axhline(y=12, color='red', linestyle='--', label='Horizontal Line at y=12')
ax.axvline(x=3, color='green', linestyle='-.', label='Vertical Line at x=3')
# plotly ref: https://plotly.com/python/horizontal-vertical-shapes/
fig.add_vline(x=2.5, line_width=3, line_dash="dash", line_color="green") # dot
fig.add_hline(y=0.9)
如果防火墙是关闭的,你可以直接部署在external address上。使用docker也是可行的办法
import matplotlib.pyplot as plt

X = [str(i) for i in metricValue]
Y = accuracyResult

# 设置图片大小
fig, ax = plt.subplots(figsize=(10, 6))  # 指定宽度为10英寸,高度为6英寸

plt.plot(X, Y, marker='o')
plt.xlabel('Threshold Percentage(%)', fontsize=12)  # 设置x轴标签字体大小为12
plt.ylabel('Average Execution Time of Static Method', fontsize=12)  # 设置y轴标签字体大小为12
plt.title('Tuning load store pressure', fontsize=14)  # 设置标题字体大小为14

for i in range(len(X)):
    plt.text(X[i], Y[i], Y[i],
        fontsize=10, # 设置文本字体大小为10
        ha='center', # 设置水平对齐方式
        va='bottom')  # 设置垂直对齐方式

# 保存图片
plt.savefig(glv._get("resultPath") + f"tuning/{tuningLabel}/loadStorePressure.png", dpi=300)  # 设置dpi为300,可调整保存图片的分辨率

plt.show()  # 显示图片
plt.close()
在柱状图中,用于表示上下浮动的元素通常被称为"误差条"(Error Bars)。误差条是用于显示数据点或柱状图中的不确定性或误差范围的线条或线段。它们在柱状图中以垂直方向延伸,可以显示上下浮动的范围,提供了一种可视化的方式来表示数据的变化或不确定性。误差条通常通过标准差、标准误差、置信区间或其他统计指标来计算和表示数据的浮动范围。
Errorbars + StackedBars stacked 的过程中由于向上的error线的会被后面的Bar遮盖,然后下面的error线由于arrayminus=[i-j for i,j in zip(sumList,down_error)]导致大部分时间说负值,也不会显示。
fig = go.Figure()

 # color from https://stackoverflow.com/questions/68596628/change-colors-in-100-stacked-barchart-plotly-python
 color_list = ['rgb(29, 105, 150)', \
             'rgb(56, 166, 165)', \
    'rgb(15, 133, 84)',\
          'rgb(95, 70, 144)']
 sumList = [0 for i in range(len(x[0]))]
 for i, entry in enumerate( barDict.items()):
  barName=entry[0]
  yList = entry[1]
  ic(sumList,yList)
  sumList = [x + y for x, y in zip(yList, sumList)]
  fig.add_bar(x=x,y=yList,
              name=barName,
              text =[f'{val:.2f}' for val in yList],
              textposition='inside',
              marker=dict(color=color_list[i]),
              error_y=dict(
    type='data',
    symmetric=False,
    color='purple',
    array=[i-j for i,j in zip(up_error,sumList)],
    arrayminus=[i-j for i,j in zip(sumList,down_error)],
       thickness=2, width=10),
              textfont=dict(size=8)
  )
类似股票上下跳动的浮标被称为"Candlestick"(蜡烛图)或"OHLC"(开盘-最高-最低-收盘)图表。
暂无
暂无
上面回答部分来自ChatGPT-3.5,暂时没有校验其可靠性(看上去貌似说得通)。
[1] Saket, B., Endert, A. and Demiralp, Ç., 2018. Task-based effectiveness of basic visualizations.IEEE transactions on visualization and computer graphics,25(7), pp.2505-2512.
对比如下:
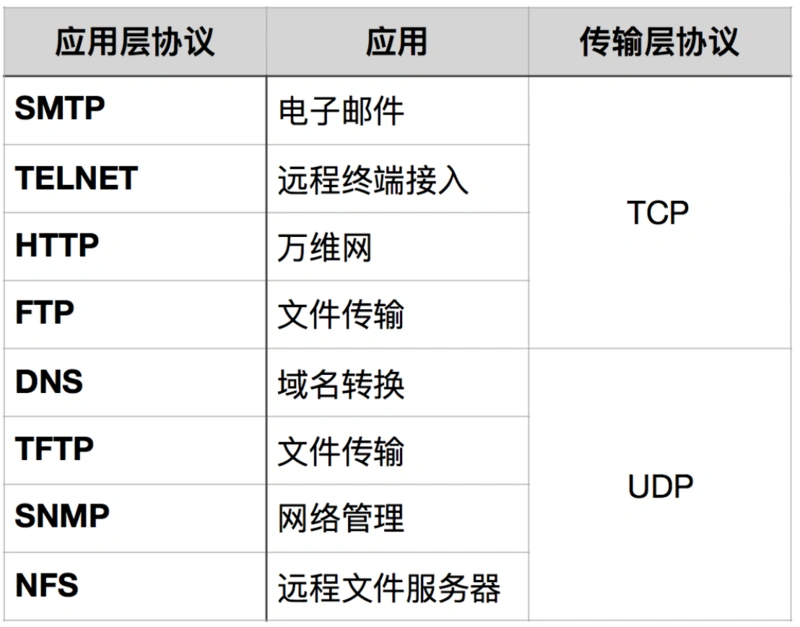
| UDP | TCP | |
|---|---|---|
| 是否连接 | 无连接 | 面向连接 |
| 是否可靠 | 不可靠传输,不使用流量控制和拥塞控制 | 可靠传输,使用流量控制和拥塞控制 |
| 是否有序 | 无序 | 有序,消息在传输过程中可能会乱序,TCP 会重新排序 |
| 传输速度 | 快 | 慢 |
| 连接对象个数 | 支持一对一,一对多,多对一和多对多交互通信 | 只能是一对一通信 |
| 传输方式 | 面向报文 | 面向字节流 |
| 首部开销 | 首部开销小,仅8字节 | 首部最小20字节,最大60字节 |
| 适用场景 | 适用于实时应用(IP电话、视频会议、直播等) | 适用于要求可靠传输的应用,例如文件传输 |
总结:
TCP 是面向连接,能保证数据的可靠性交付,因此经常用于:
UDP 面向无连接,它可以随时发送数据,再加上UDP本身的处理既简单又高效,因此经常用于:
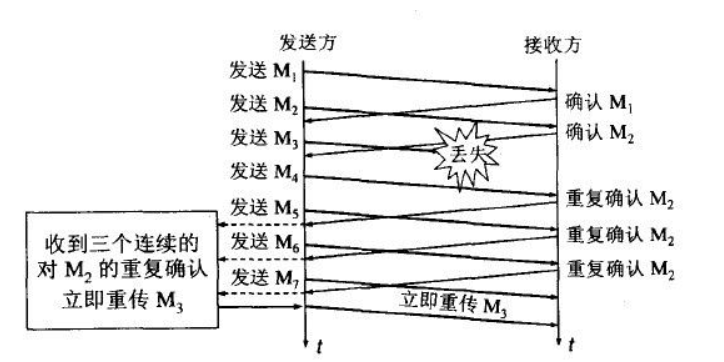
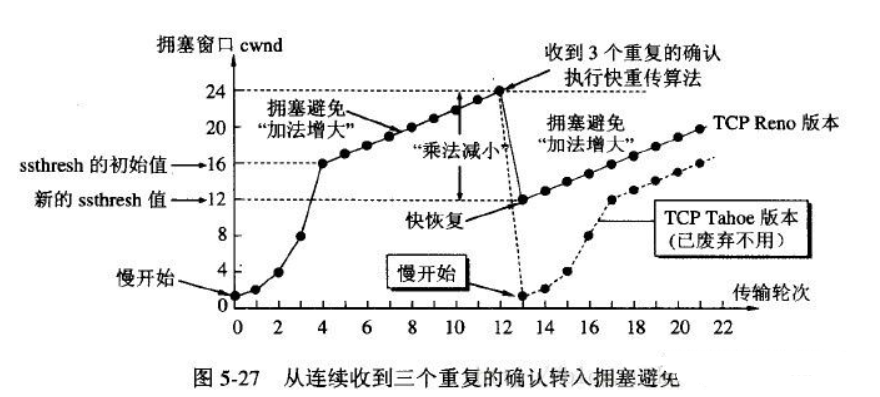
TCP主要提供了检验和、序列号/确认应答、超时重传、滑动窗口、拥塞控制和 流量控制等方法实现了可靠性传输。
TCP 一共使用了四种算法来实现拥塞控制:
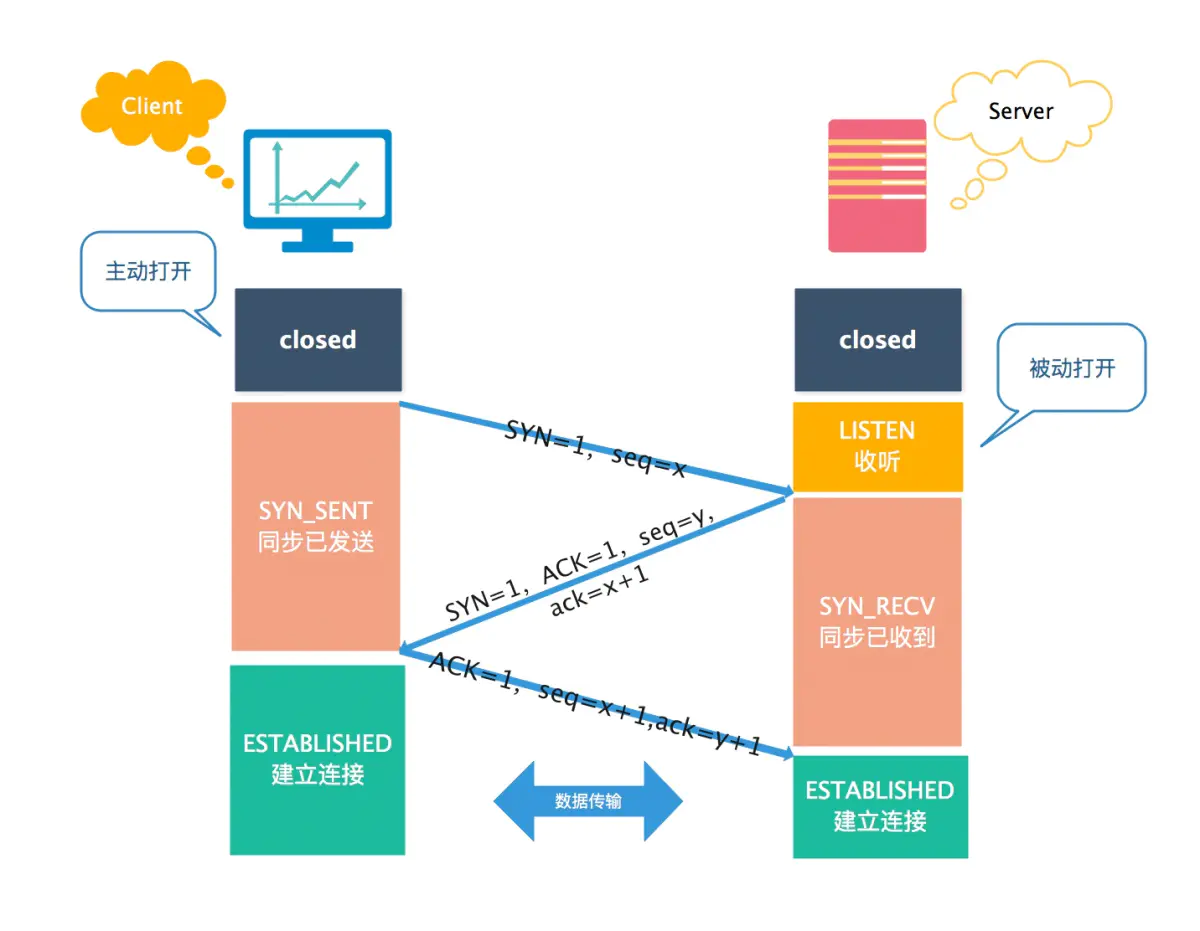
三次握手机制:
seq = x 作为初始序列号,ack = x + 1,同时选择一个随机数 seq = y 作为初始序列号,ack = y + 1,序列号为 seq = x + 1,理想状态下,TCP连接一旦建立,在通信双方中的任何一方主动关闭连接之前,TCP 连接都将被一直保持下去。
主要有三个原因:
在双方两次握手即可建立连接的情况下,假设客户端发送 A 报文段请求建立连接,由于网络原因造成 A 暂时无法到达服务器,服务器接收不到请求报文段就不会返回确认报文段。
客户端在长时间得不到应答的情况下重新发送请求报文段 B,这次 B 顺利到达服务器,服务器随即返回确认报文并进入 ESTABLISHED 状态,客户端在收到 确认报文后也进入 ESTABLISHED 状态,双方建立连接并传输数据,之后正常断开连接。
此时姗姗来迟的 A 报文段才到达服务器,服务器随即返回确认报文并进入 ESTABLISHED 状态,但是已经进入 CLOSED 状态的客户端无法再接受确认报文段,更无法进入 ESTABLISHED 状态,这将导致服务器长时间单方面等待,造成资源浪费。
第一次握手:客户端只是发送处请求报文段,什么都无法确认,而服务器可以确认自己的接收能力和对方的发送能力正常;
第二次握手:客户端可以确认自己发送能力和接收能力正常,对方发送能力和接收能力正常;
第三次握手:服务器可以确认自己发送能力和接收能力正常,对方发送能力和接收能力正常;
可见三次握手才能让双方都确认自己和对方的发送和接收能力全部正常,这样就可以愉快地进行通信了。
TCP 实现了可靠的数据传输,原因之一就是 TCP 报文段中维护了序号字段和确认序号字段,通过这两个字段双方都可以知道在自己发出的数据中,哪些是已经被对方确认接收的。这两个字段的值会在初始序号值得基础递增,如果是两次握手,只有发起方的初始序号可以得到确认,而另一方的初始序号则得不到确认。
因为三次握手已经可以确认双方的发送接收能力正常,双方都知道彼此已经准备好,而且也可以完成对双方初始序号值得确认,也就无需再第四次握手了。
SYN洪泛攻击属于 DOS 攻击的一种,它利用 TCP 协议缺陷,通过发送大量的半连接请求,耗费 CPU 和内存资源。
原理:
[SYN/ACK] 包(第二个包)之后、收到客户端的 [ACK] 包(第三个包)之前的 TCP 连接称为半连接(half-open connect),SYN_RECV(等待客户端响应)状态。如果接收到客户端的 [ACK],则 TCP 连接成功,[SYN] 包,服务器回复 [SYN/ACK] 包,并等待客户的确认。由于源地址是不存在的,服务器需要不断的重发直至超时。[SYN] 包将长时间占用未连接队列,影响了正常的 SYN,导致目标系统运行缓慢、网络堵塞甚至系统瘫痪。检测:当在服务器上看到大量的半连接状态时,特别是源 IP 地址是随机的,基本上可以断定这是一次 SYN 攻击。
防范:
服务端:
客户端:
客户端认为这个连接已经建立,如果客户端向服务端发送数据,服务端将以RST包(Reset,标示复位,用于异常的关闭连接)响应。此时,客户端知道第三次握手失败。
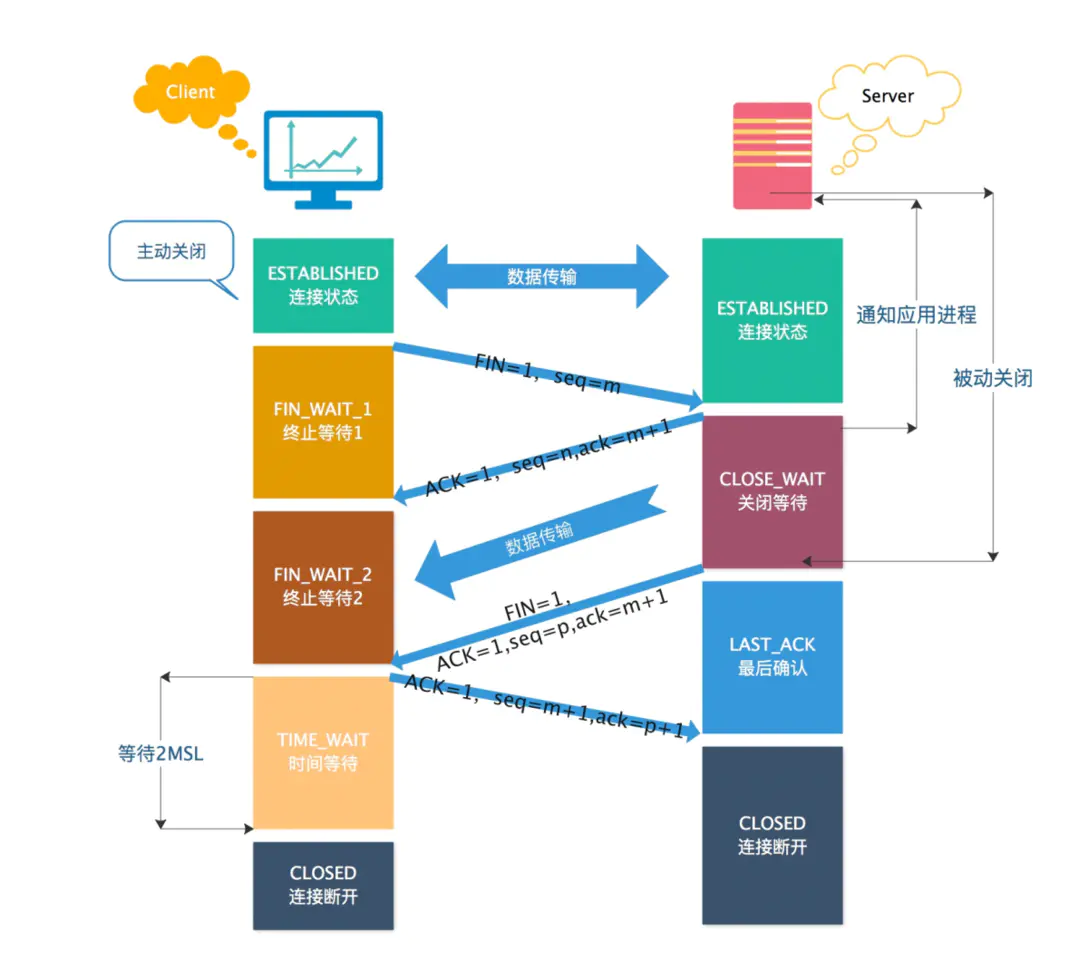
第一次挥手:客户端向服务端发送连接释放报文(FIN=1,ACK=1),主动关闭连接,同时等待服务端的确认。
序列号 seq = u,即客户端上次发送的报文的最后一个字节的序号 + 1
确认号 ack = k, 即服务端上次发送的报文的最后一个字节的序号 + 1
第二次挥手:服务端收到连接释放报文后,立即发出确认报文(ACK=1),序列号 seq = k,确认号 ack = u + 1。
这时 TCP 连接处于半关闭状态,即客户端到服务端的连接已经释放了,但是服务端到客户端的连接还未释放。这表示客户端已经没有数据发送了,但是服务端可能还要给客户端发送数据。
第三次挥手:服务端向客户端发送连接释放报文(FIN=1,ACK=1),主动关闭连接,同时等待 A 的确认。
序列号 seq = w,即服务端上次发送的报文的最后一个字节的序号 + 1。
确认号 ack = u + 1,与第二次挥手相同,因为这段时间客户端没有发送数据
第四次挥手:客户端收到服务端的连接释放报文后,立即发出确认报文(ACK=1),序列号 seq = u + 1,确认号为 ack = w + 1。
此时,客户端就进入了 TIME-WAIT 状态。注意此时客户端到 TCP 连接还没有释放,必须经过 2*MSL(最长报文段寿命)的时间后,才进入 CLOSED 状态。而服务端只要收到客户端发出的确认,就立即进入 CLOSED 状态。可以看到,服务端结束 TCP 连接的时间要比客户端早一些。
服务器在收到客户端的 FIN 报文段后,可能还有一些数据要传输,所以不能马上关闭连接,但是会做出应答,返回 ACK 报文段.
接下来可能会继续发送数据,在数据发送完后,服务器会向客户单发送 FIN 报文,表示数据已经发送完毕,请求关闭连接。服务器的ACK和FIN一般都会分开发送,从而导致多了一次,因此一共需要四次挥手。
主要有两个原因:
第四次挥手时,客户端第四次挥手的 ACK 报文不一定会到达服务端。服务端会超时重传 FIN/ACK 报文,此时如果客户端已经断开了连接,那么就无法响应服务端的二次请求,这样服务端迟迟收不到 FIN/ACK 报文的确认,就无法正常断开连接。
MSL 是报文段在网络上存活的最长时间。客户端等待 2MSL 时间,即「客户端 ACK 报文 1MSL 超时 + 服务端 FIN 报文 1MSL 传输」,就能够收到服务端重传的 FIN/ACK 报文,然后客户端重传一次 ACK 报文,并重新启动 2MSL 计时器。如此保证服务端能够正常关闭。
如果服务端重发的 FIN 没有成功地在 2MSL 时间里传给客户端,服务端则会继续超时重试直到断开连接。
TCP 要求在 2MSL 内不使用相同的序列号。客户端在发送完最后一个 ACK 报文段后,再经过时间 2MSL,就可以保证本连接持续的时间内产生的所有报文段都从网络中消失。这样就可以使下一个连接中不会出现这种旧的连接请求报文段。或者即使收到这些过时的报文,也可以不处理它。
或者说,如果三次握手阶段、四次挥手阶段的包丢失了怎么办?如“服务端重发 FIN丢失”的问题。
简而言之,通过定时器 + 超时重试机制,尝试获取确认,直到最后会自动断开连接。
具体而言,TCP 设有一个保活计时器。服务器每收到一次客户端的数据,都会重新复位这个计时器,时间通常是设置为 2 小时。若 2 小时还没有收到客户端的任何数据,服务器就开始重试:每隔 75 分钟发送一个探测报文段,若一连发送 10 个探测报文后客户端依然没有回应,那么服务器就认为连接已经断开了。
从服务器来讲,短时间内关闭了大量的Client连接,就会造成服务器上出现大量的TIME_WAIT连接,严重消耗着服务器的资源,此时部分客户端就会显示连接不上。
从客户端来讲,客户端TIME_WAIT过多,就会导致端口资源被占用,因为端口就65536个,被占满就会导致无法创建新的连接。
解决办法:
服务器可以设置 SO_REUSEADDR 套接字选项来避免 TIME_WAIT状态,此套接字选项告诉内核,即使此端口正忙(处于 TIME_WAIT状态),也请继续并重用它。
调整系统内核参数,修改/etc/sysctl.conf文件,即修改net.ipv4.tcp_tw_reuse 和 tcp_timestamps
net.ipv4.tcp_tw_reuse = 1 表示开启重用。允许将TIME-WAIT sockets重新用于新的TCP连接,默认为0,表示关闭;
net.ipv4.tcp_tw_recycle = 1 表示开启TCP连接中TIME-WAIT sockets的快速回收,默认为0,表示关闭。
TIME_WAIT 是主动断开连接的一方会进入的状态,一般情况下,都是客户端所处的状态;服务器端一般设置不主动关闭连接。
TIME_WAIT 需要等待 2MSL,在大量短连接的情况下,TIME_WAIT会太多,这也会消耗很多系统资源。对于服务器来说,在 HTTP 协议里指定 KeepAlive(浏览器重用一个 TCP 连接来处理多个 HTTP 请求),由浏览器来主动断开连接,可以一定程度上减少服务器的这个问题。
现在有一个数据部分长度为8192B的数据需要通过UDP在以太网上传播,经过分片化为多个IP数据报片,这些片中的数据部分长度都有哪些?(假设按照最大长度分片), 计网习题
暂无
暂无
无