TLB: real pagewalk overhead
简介
TLB的介绍,请看
页表相关
理论基础
大体上是应用访问越随机, 数据量越大,pgw开销越大。
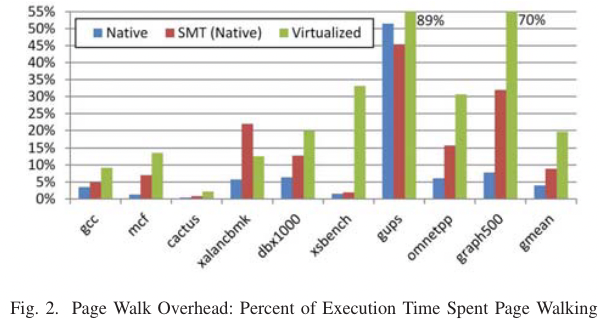
ISCA 2013 shows the pgw overhead in big memory servers.
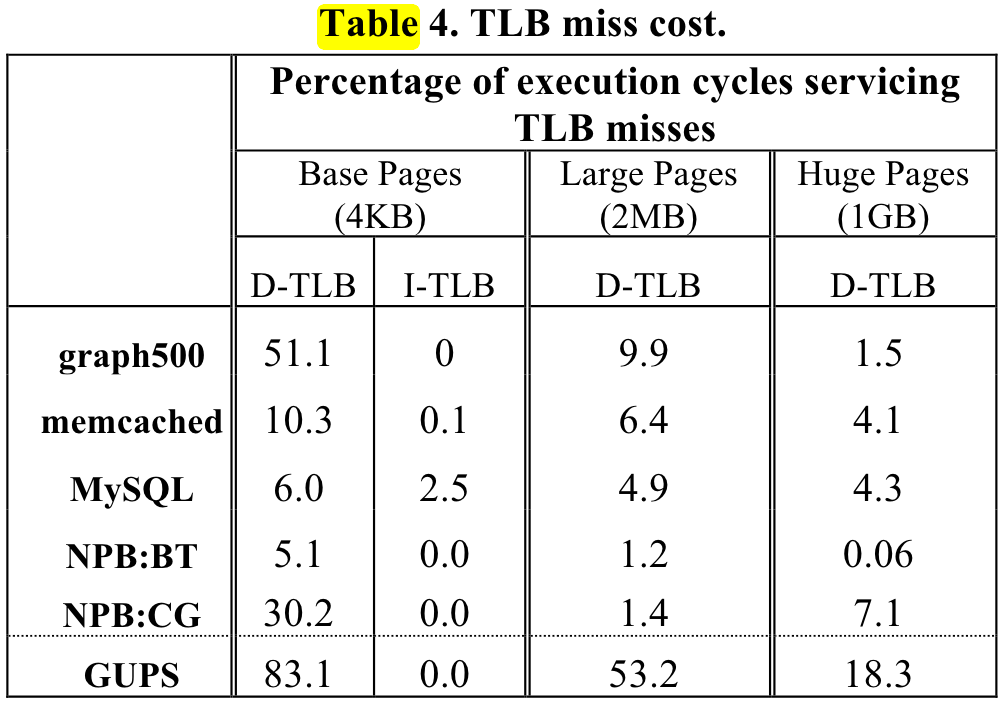
or ISCA 2020 Guvenilir 和 Patt - 2020 - Tailored Page Sizes.pdf
机器配置
# shaojiemike @ snode6 in ~/github/hugoMinos on git:main x [11:17:05]
$ cpuid -1 -l 2
CPU:
      0x63: data TLB: 2M/4M pages, 4-way, 32 entries
            data TLB: 1G pages, 4-way, 4 entries
      0x03: data TLB: 4K pages, 4-way, 64 entries
      0x76: instruction TLB: 2M/4M pages, fully, 8 entries
      0xff: cache data is in CPUID leaf 4
      0xb5: instruction TLB: 4K, 8-way, 64 entries
      0xf0: 64 byte prefetching
      0xc3: L2 TLB: 4K/2M pages, 6-way, 1536 entries
# if above command turns out empty
cpuid -1 |grep TLB -A 10 -B 5
# will show sth like

L1 TLB/cache information: 2M/4M pages & L1 TLB (0x80000005/eax):
    instruction # entries     = 0x40 (64)
    instruction associativity = 0xff (255)
    data # entries            = 0x40 (64)
    data associativity        = 0xff (255)
L1 TLB/cache information: 4K pages & L1 TLB (0x80000005/ebx):
    instruction # entries     = 0x40 (64)
    instruction associativity = 0xff (255)
    data # entries            = 0x40 (64)
    data associativity        = 0xff (255)
L2 TLB/cache information: 2M/4M pages & L2 TLB (0x80000006/eax):
    instruction # entries     = 0x200 (512)
    instruction associativity = 2-way (2)
    data # entries            = 0x800 (2048)
    data associativity        = 4-way (4)
L2 TLB/cache information: 4K pages & L2 TLB (0x80000006/ebx):
    instruction # entries     = 0x200 (512)
    instruction associativity = 4-way (4)
    data # entries            = 0x800 (2048)
    data associativity        = 8-way (6)
OS config
default there is no hugopage(usually 4MB) to use.
$ cat /proc/meminfo | grep huge -i
AnonHugePages:      8192 kB
ShmemHugePages:        0 kB
FileHugePages:         0 kB
HugePages_Total:       0
HugePages_Free:        0
HugePages_Rsvd:        0
HugePages_Surp:        0
Hugepagesize:       2048 kB
Hugetlb:               0 kB
explained is here.
设置页表大小
other ways: change source code
- way1: Linux transparent huge page (THP) support allows the kernel to automatically promote regular memory pages into huge pages,
cat /sys/kernel/mm/transparent_hugepage/enabledbut achieve this needs some details. - way2: Huge pages are allocated from a reserved pool which needs to change sys-config. for example
echo 20 > /proc/sys/vm/nr_hugepages. And you need to write speacial C++ code to use the hugo page
# using mmap system call to request huge page
mount -t hugetlbfs \
    -o uid=<value>,gid=<value>,mode=<value>,pagesize=<value>,size=<value>,\
    min_size=<value>,nr_inodes=<value> none /mnt/huge
without recompile
But there is a blog using unmaintained tool hugeadm and iodlr library to do this.
sudo apt install libhugetlbfs-bin
sudo hugeadm --create-global-mounts
sudo hugeadm --pool-pages-min 2M:64
So meminfo is changed
$ cat /proc/meminfo | grep huge -i
AnonHugePages:      8192 kB
ShmemHugePages:        0 kB
FileHugePages:         0 kB
HugePages_Total:      64
HugePages_Free:       64
HugePages_Rsvd:        0
HugePages_Surp:        0
Hugepagesize:       2048 kB
Hugetlb:          131072 kB
using iodlr library
应用测量
Measurement tools from code
# shaojiemike @ snode6 in ~/github/PIA_huawei on git:main x [17:40:50]
$ ./investigation/pagewalk/tlbstat -c '/staff/shaojiemike/github/sniper_PIMProf/PIMProf/gapbs/sssp.inj -f /staff/shaojiemike/github/sniper_PIMProf/PIMProf/gapbs/benchmark/kron-20.wsg -n1'
command is /staff/shaojiemike/github/sniper_PIMProf/PIMProf/gapbs/sssp.inj -f /staff/shaojiemike/github/sniper_PIMProf/PIMProf/gapbs/benchmark/kron-20.wsg -n1
K_CYCLES   K_INSTR      IPC DTLB_WALKS ITLB_WALKS K_DTLBCYC  K_ITLBCYC  DTLB% ITLB%
324088     207256      0.64 733758     3276       18284      130         5.64  0.04
21169730   11658340    0.55 11802978   757866     316625     24243       1.50  0.11
平均单次开销(开始到稳定): dtlb miss read need 24~50 cycle ,itlb miss read need 40~27 cycle
案例的时间分布:
- 读数据开销占比不大,2.5%左右
- pagerank等图应用并行计算时,飙升至 22%
- bfs 最多就是 5%,没有那么随机的访问。
- 但是gemv 在
65000 100000超内存前,即使是全部在计算,都是0.24% - 原因:访存模式:图应用的访存模式通常是随机的、不规则的。它们不像矩阵向量乘法(gemv)等应用那样具有良好的访存模式,后者通常以连续的方式访问内存。连续的内存访问可以利用空间局部性,通过预取和缓存块的方式减少TLB缺失的次数。
- github - GUOPS can achive 90%
- DAMOV - ligra - pagerank can achive 90% in 20M input case
gemm
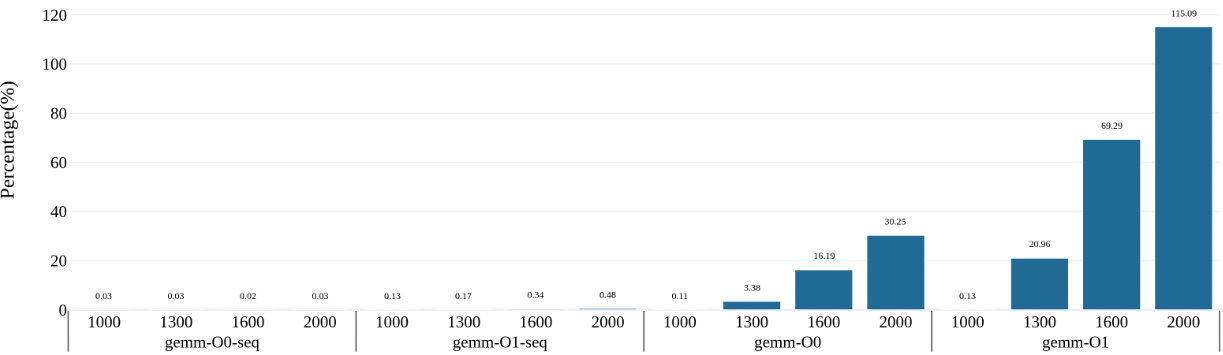
- nomal gemm can achive 100% some situation
- matrix too big can not be filled in cache, matrix2 access jump lines so always cache miss
- O3 flag seems no time reduce, beacause there is no SIMD assembly in code
- memory access time = pgw + tlb access time + load data 2 cache time
the gemm's core line is
for(int i=0; i<N; i++){
   // ignore the overflow, do not influence the running time.
   for(int j=0; j<N; j++){
      for(int l=0; l<N; l++){
            // gemm
            // ans[i * N + j] += matrix1[i * N + l] * matrix2[l * N + j];

            // for gemm sequantial
            ans[i * N + j] += matrix1[i * N + l] * matrix2[j * N + l];
      }
   }
}
and real time breakdown is as followed. to do
- first need to perf get the detail time
bigJump
manual code to test if tlb entries is run out
$ ./tlbstat -c '../../test/manual/bigJump.exe 1 10 100'
command is ../../test/manual/bigJump.exe 1 10 100
K_CYCLES   K_INSTR      IPC DTLB_WALKS ITLB_WALKS K_DTLBCYC  K_ITLBCYC  DTLB% ITLB%
2002404    773981      0.39 104304528  29137      2608079    684        130.25  0.03

$ perf stat -e mem_uops_retired.all_loads -e mem_uops_retired.all_stores -e mem_uops_retired.stlb_miss_loads -e mem_uops_retired.stlb_miss_stores ./bigJump.exe 1 10 500
Number read from command line: 1 10 (N,J should not big, [0,5] is best.)
result 0
 Performance counter stats for './bigJump.exe 1 10 500':

          10736645      mem_uops_retired.all_loads
         532100339      mem_uops_retired.all_stores
             57715      mem_uops_retired.stlb_miss_loads
         471629056      mem_uops_retired.stlb_miss_stores
In this case, tlb miss rate up to 47/53 = 88.6%
Big bucket hash table
using big hash table
other apps
Any algorithm that does random accesses into a large memory region will likely suffer from TLB misses. Examples are plenty: binary search in a big array, large hash tables, histogram-like algorithms, etc.
需要进一步的研究学习
暂无
遇到的问题
暂无
开题缘由、总结、反思、吐槽~~
参考文献
上面回答部分来自ChatGPT-3.5,没有进行正确性的交叉校验。
无