Tutorials
OpenMP
线程绑定
OpenMP 4.0 提供 OMP_PLACES 和 OMP_PROC_BIND 环境变量来指定程序中的 OpenMP 线程如何绑定到处理器。这两个环境变量通常结合使用。OMP_PLACES 用于指定线程将绑定到的计算机位置(硬件线程、核心或插槽)。OMP_PROC_BIND 用于指定绑定策略(线程关联性策略),这项策略指定如何将线程分配到位置。
除了 OMP_PLACES 和 OMP_PROC_BIND 这两个环境变量外,OpenMP 4.0 还提供可在 parallel 指令中使用的 proc_bind 子句。proc_bind 子句用于指定如何将执行并行区域的线程组绑定到处理器。
OMP_NUM_THREADS=28 OMP_PROC_BIND=true OMP_PLACES=cores:每个线程绑定到一个 core,使用默认的分布(线程 n 绑定到 core n);
OMP_NUM_THREADS=2 OMP_PROC_BIND=true OMP_PLACES=sockets:每个线程绑定到一个 socket;
OMP_NUM_THREADS=4 OMP_PROC_BIND=close OMP_PLACES=cores:每个线程绑定到一个 core,线程在 socket 上连续分布(分别绑定到 core 0,1,2,3;
OMP_NUM_THREADS=4 OMP_PROC_BIND=spread OMP_PLACES=cores:每个线程绑定到一个 core,线程在 socket 上尽量散开分布(分别绑定到 core 0,7,14,21;
编译制导格式
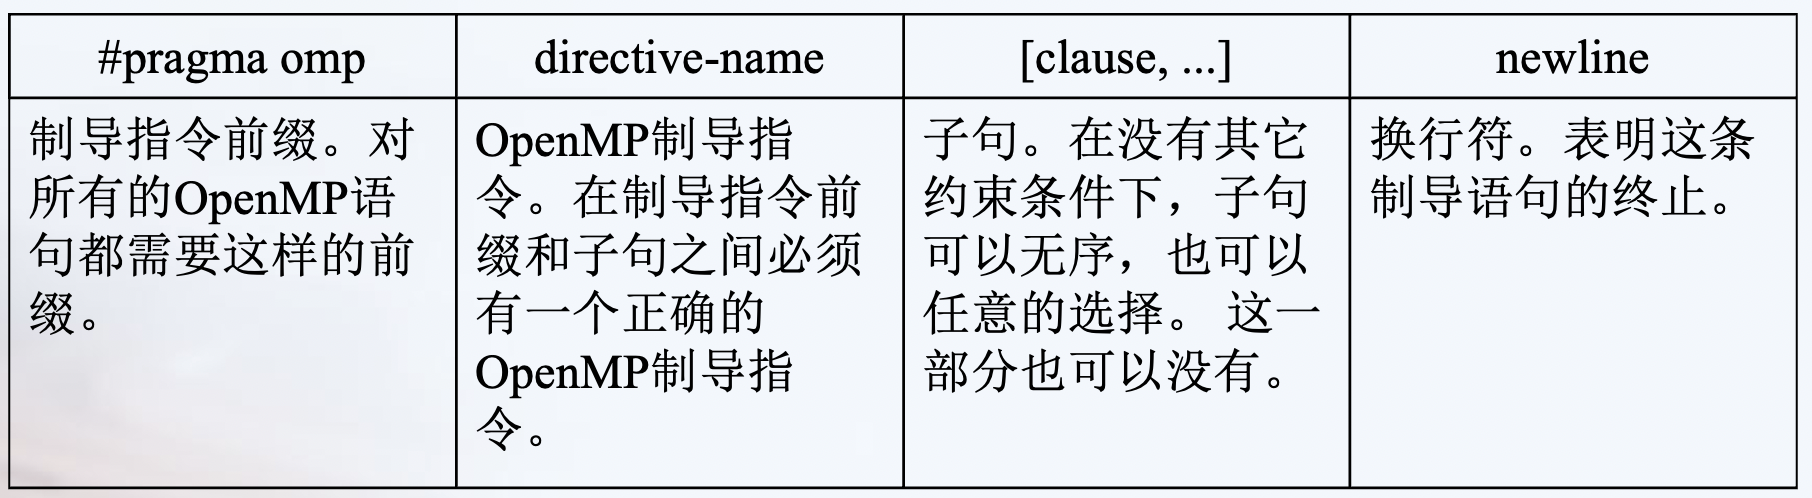
静态扩展 * 文本代码在一个编译制导语句之后,被封装到一个结构块中
孤立语句 * 一个OpenMP的编译制导语句不依赖于其它的语句
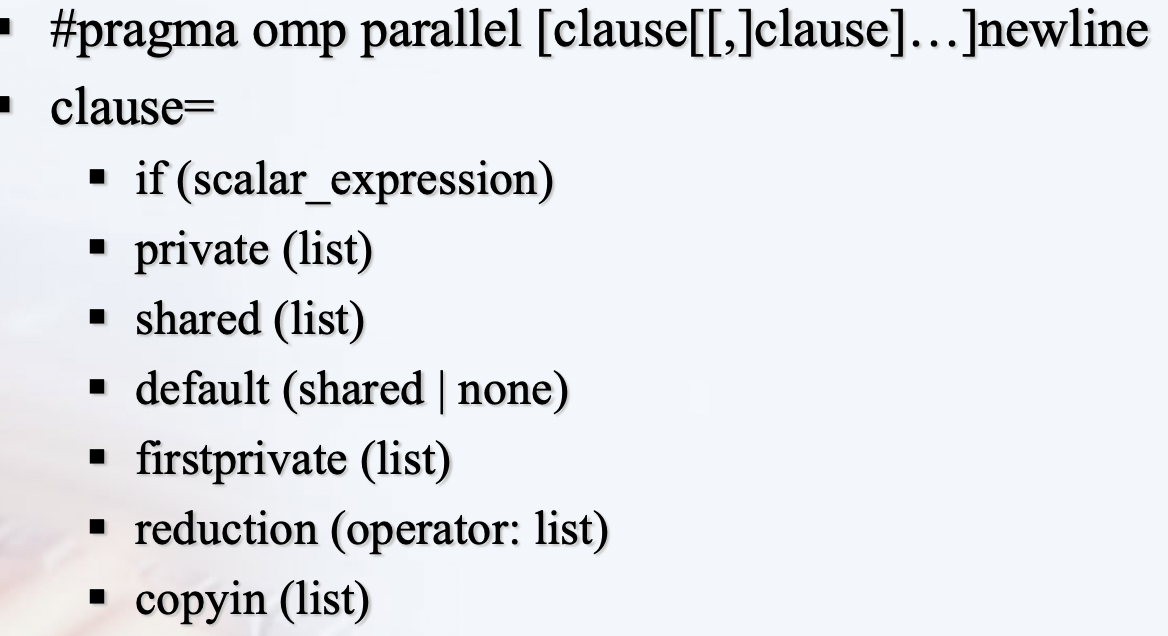
parallel
并行域中的代码被所有的线程执行
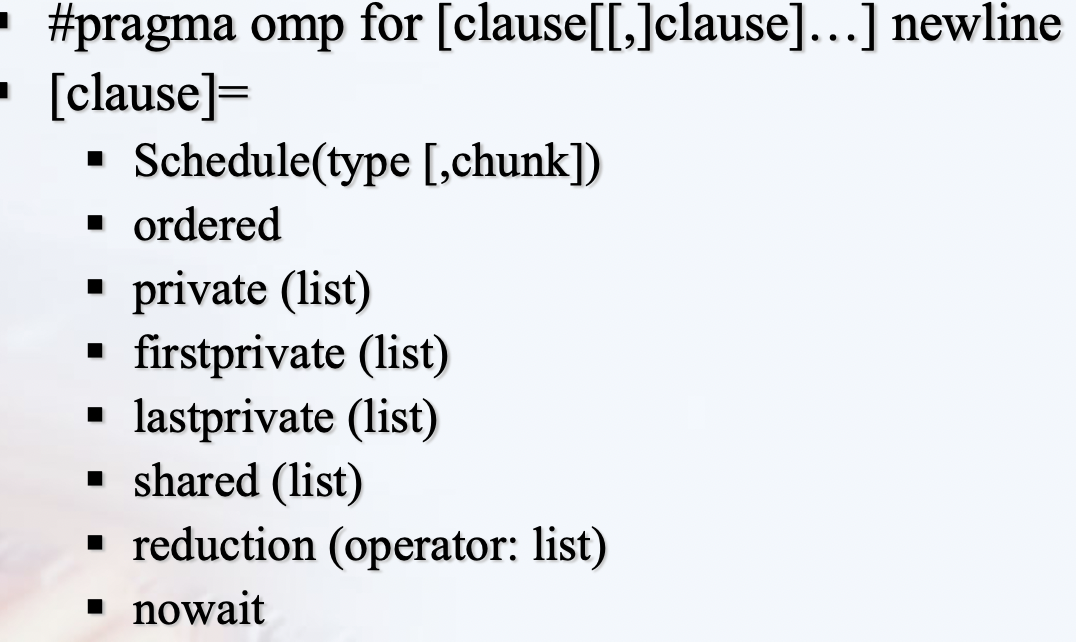
for
for语句指定紧随它的循环语句必须由线程组并行执行;
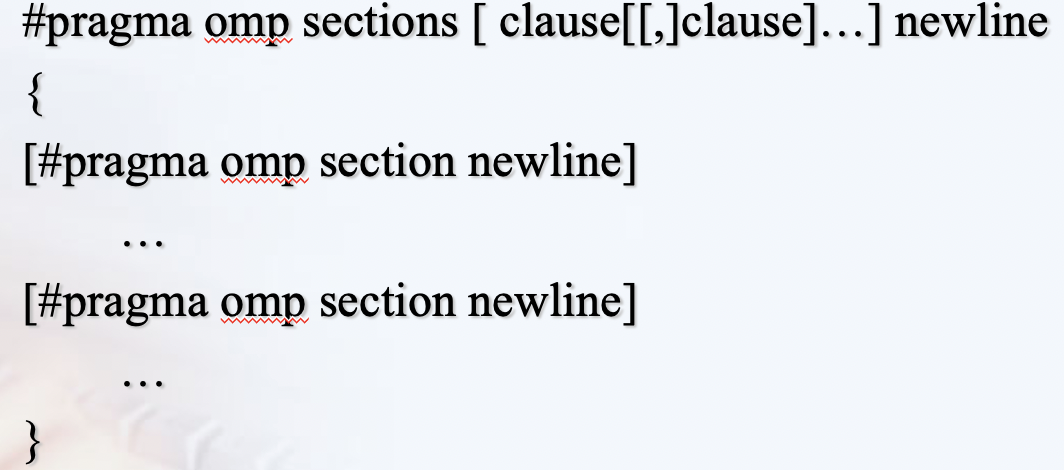
sections
sections编译制导语句指定内部的代码被划分给线程组中的各线程
不同的section由不同的线程执行
single
single编译制导语句指定内部代码只有线程组中的一个线程执行。
线程组中没有执行single语句的线程会一直等待代码块的结束,使用nowait子句除外

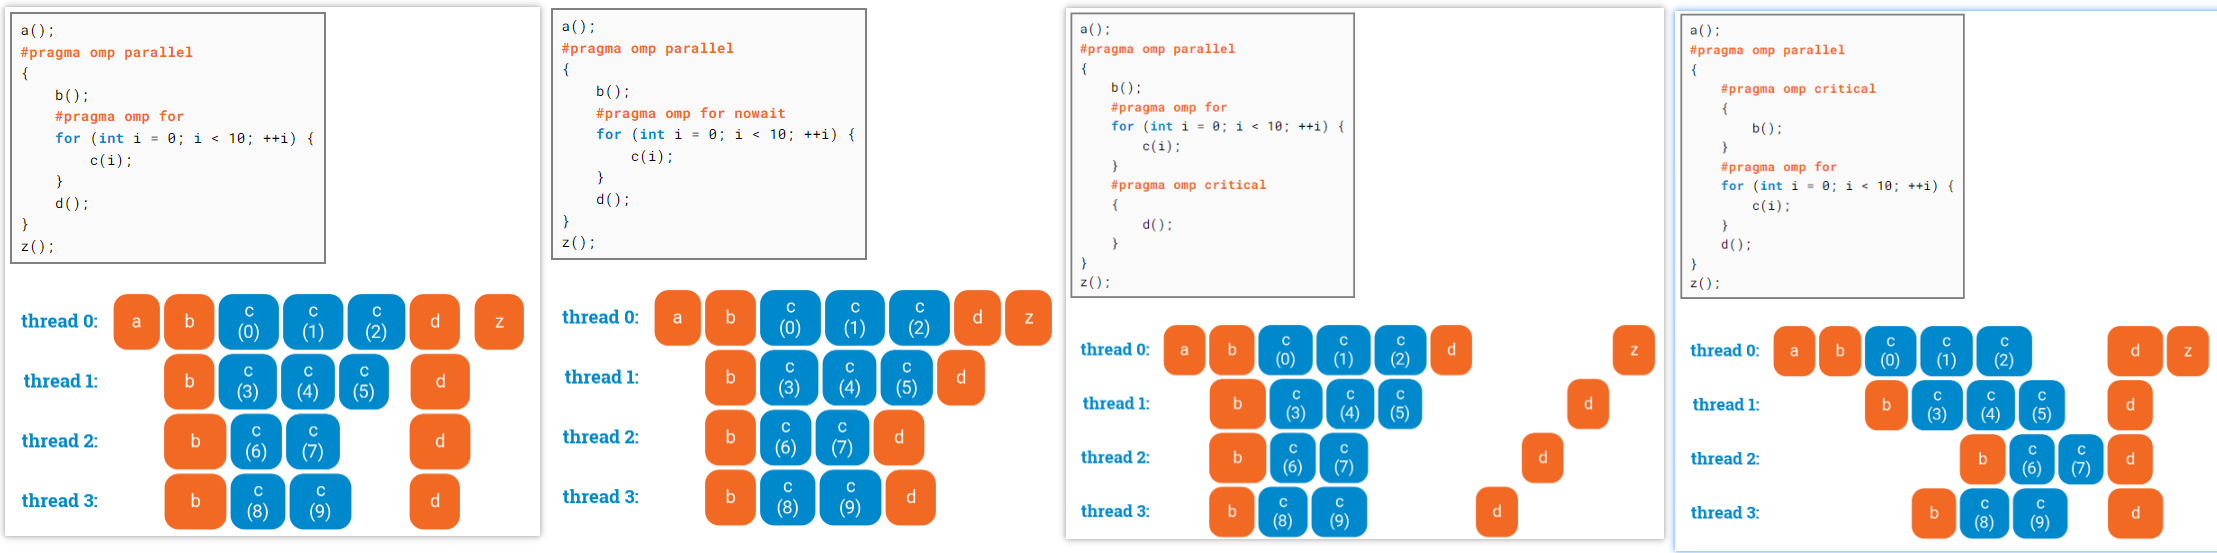
来自 https://ppc.cs.aalto.fi/ch3/nowait/
组合parallel for / parallel sections 编译制导语句
- Parallel for编译制导语句表明一个并行域包含一个独立的for语句
- parallel sections编译制导语句表明一个并行域包含单独的一个sections语句
同步结构
- master 制导语句
- 指定代码段只有主线程执行
- critical制导语句
- critical制导语句表明域中的代码一次只能执行一个线程,其他线程被阻塞在临界区
- 语句格式:
#pragma omp critical [name] newline - barrier制导语句
- 同步一个线程组中所有的线程,先到达的线程在此阻塞,等待其他线程
- atomic制导语句
- 指定特定的存储单元将被原子更新
#pragma omp atomic x++;- flush制导语句
- 标识一个同步点,用以确保所有的线程看到一致的存储器视图

- ordered制导语句
- 相对于critical,多了一个顺序
- 只能出现在for或者parallel for语句的动态范围中
- threadprivate语句使一个全局文件作用域的变量在并行域内变成每个线程私有
- 每个线程对该变量复制一份私有拷贝
critical vs atomic
The fastest way is neither critical nor atomic. Approximately, addition with critical section is 200 times more expensive than simple addition, atomic addition is 25 times more expensive then simple addition.(maybe no so much expensive, the atomic operation will have a few cycle overhead (synchronizing a cache line) on the cost of roughly a cycle. A critical section incurs the cost of a lock.)
The fastest option (not always applicable) is to give each thread its own counter and make reduce operation when you need total sum.
critical vs ordered
omp critical is for mutual exclusion(互斥), omp ordered refers to a specific loop and ensures that the region executes sequentually in the order of loop iterations. Therefore omp ordered is stronger than omp critical, but also only makes sense within a loop.
omp ordered has some other clauses, such as simd to enforce the use of a single SIMD lane only. You can also specify dependencies manually with the depend clause.
Note: Both omp critical and omp ordered regions have an implicit memory flush at the entry and the exit.
ordered example
vector<int> v;

#pragma omp parallel for ordered schedule(dynamic, anyChunkSizeGreaterThan1)
    for (int i = 0; i < n; ++i){
            ...
            ...
            ...
#pragma omp ordered
            v.push_back(i);
    }
tid  List of     Timeline
     iterations
0    0,1,2       ==o==o==o
1    3,4,5       ==.......o==o==o
2    6,7,8       ==..............o==o==o
= shows that the thread is executing code in parallel. o is when the thread is executing the ordered region. . is the thread being idle, waiting for its turn to execute the ordered region.
With schedule(static,1) the following would happen:
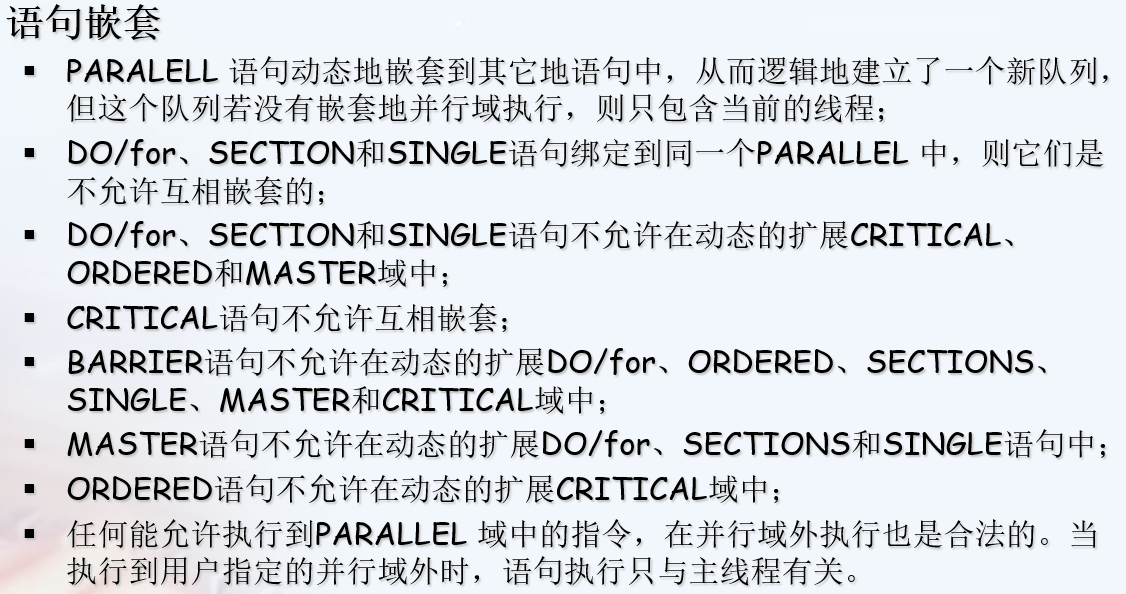
语句绑定与语句嵌套规则

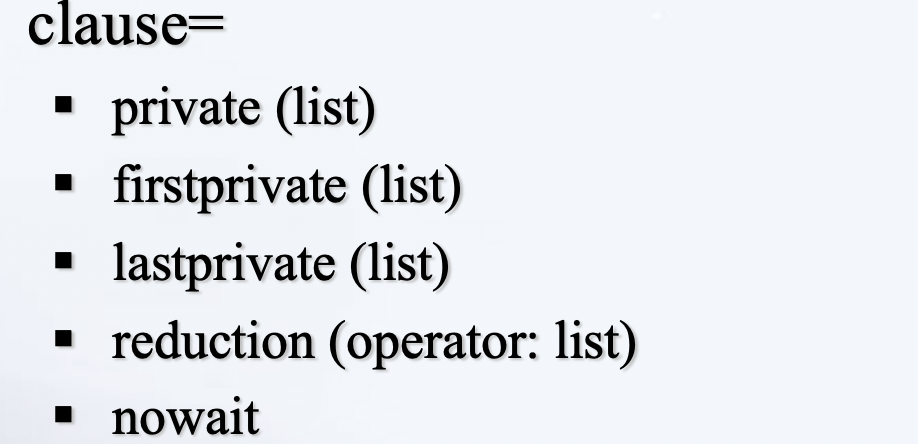
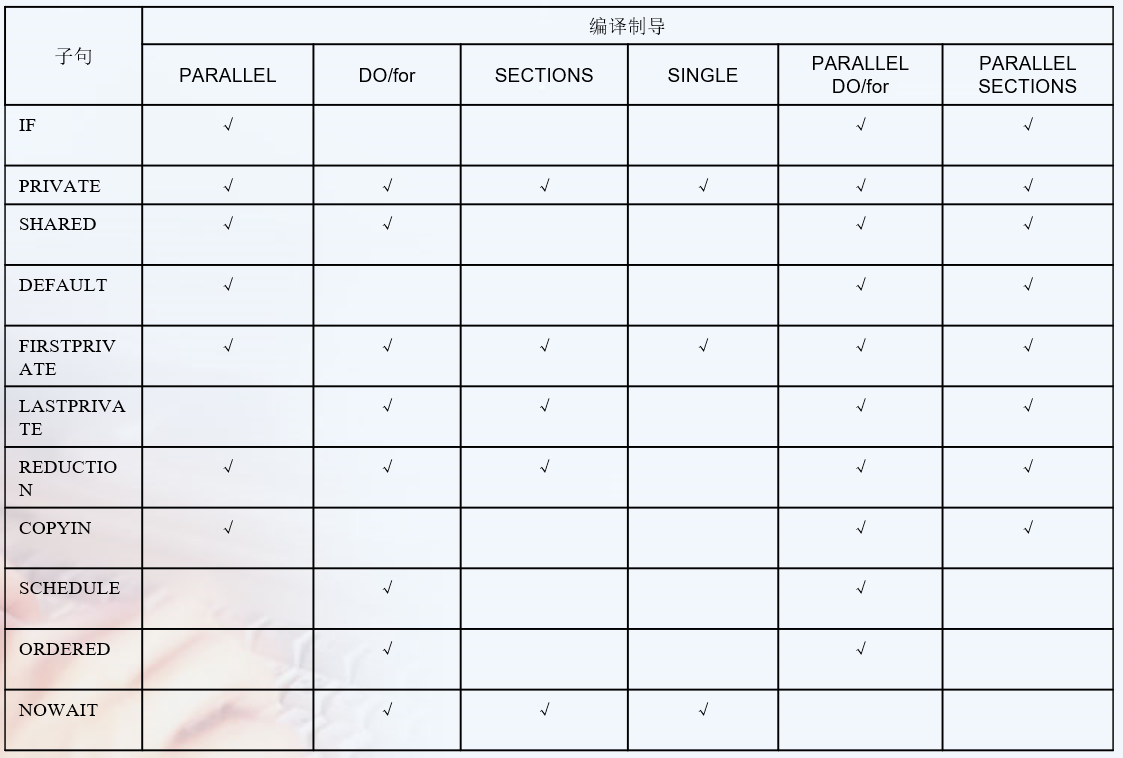
Clauses 子句
见 https://docs.microsoft.com/en-us/cpp/parallel/openmp/reference/openmp-clauses?view=msvc-160
#pragma omp parallel for collapse(2)
for( int y = y1; y < y2; y++ )
{
    for( int x = x1; x < x2; x++ )
    {
schedule
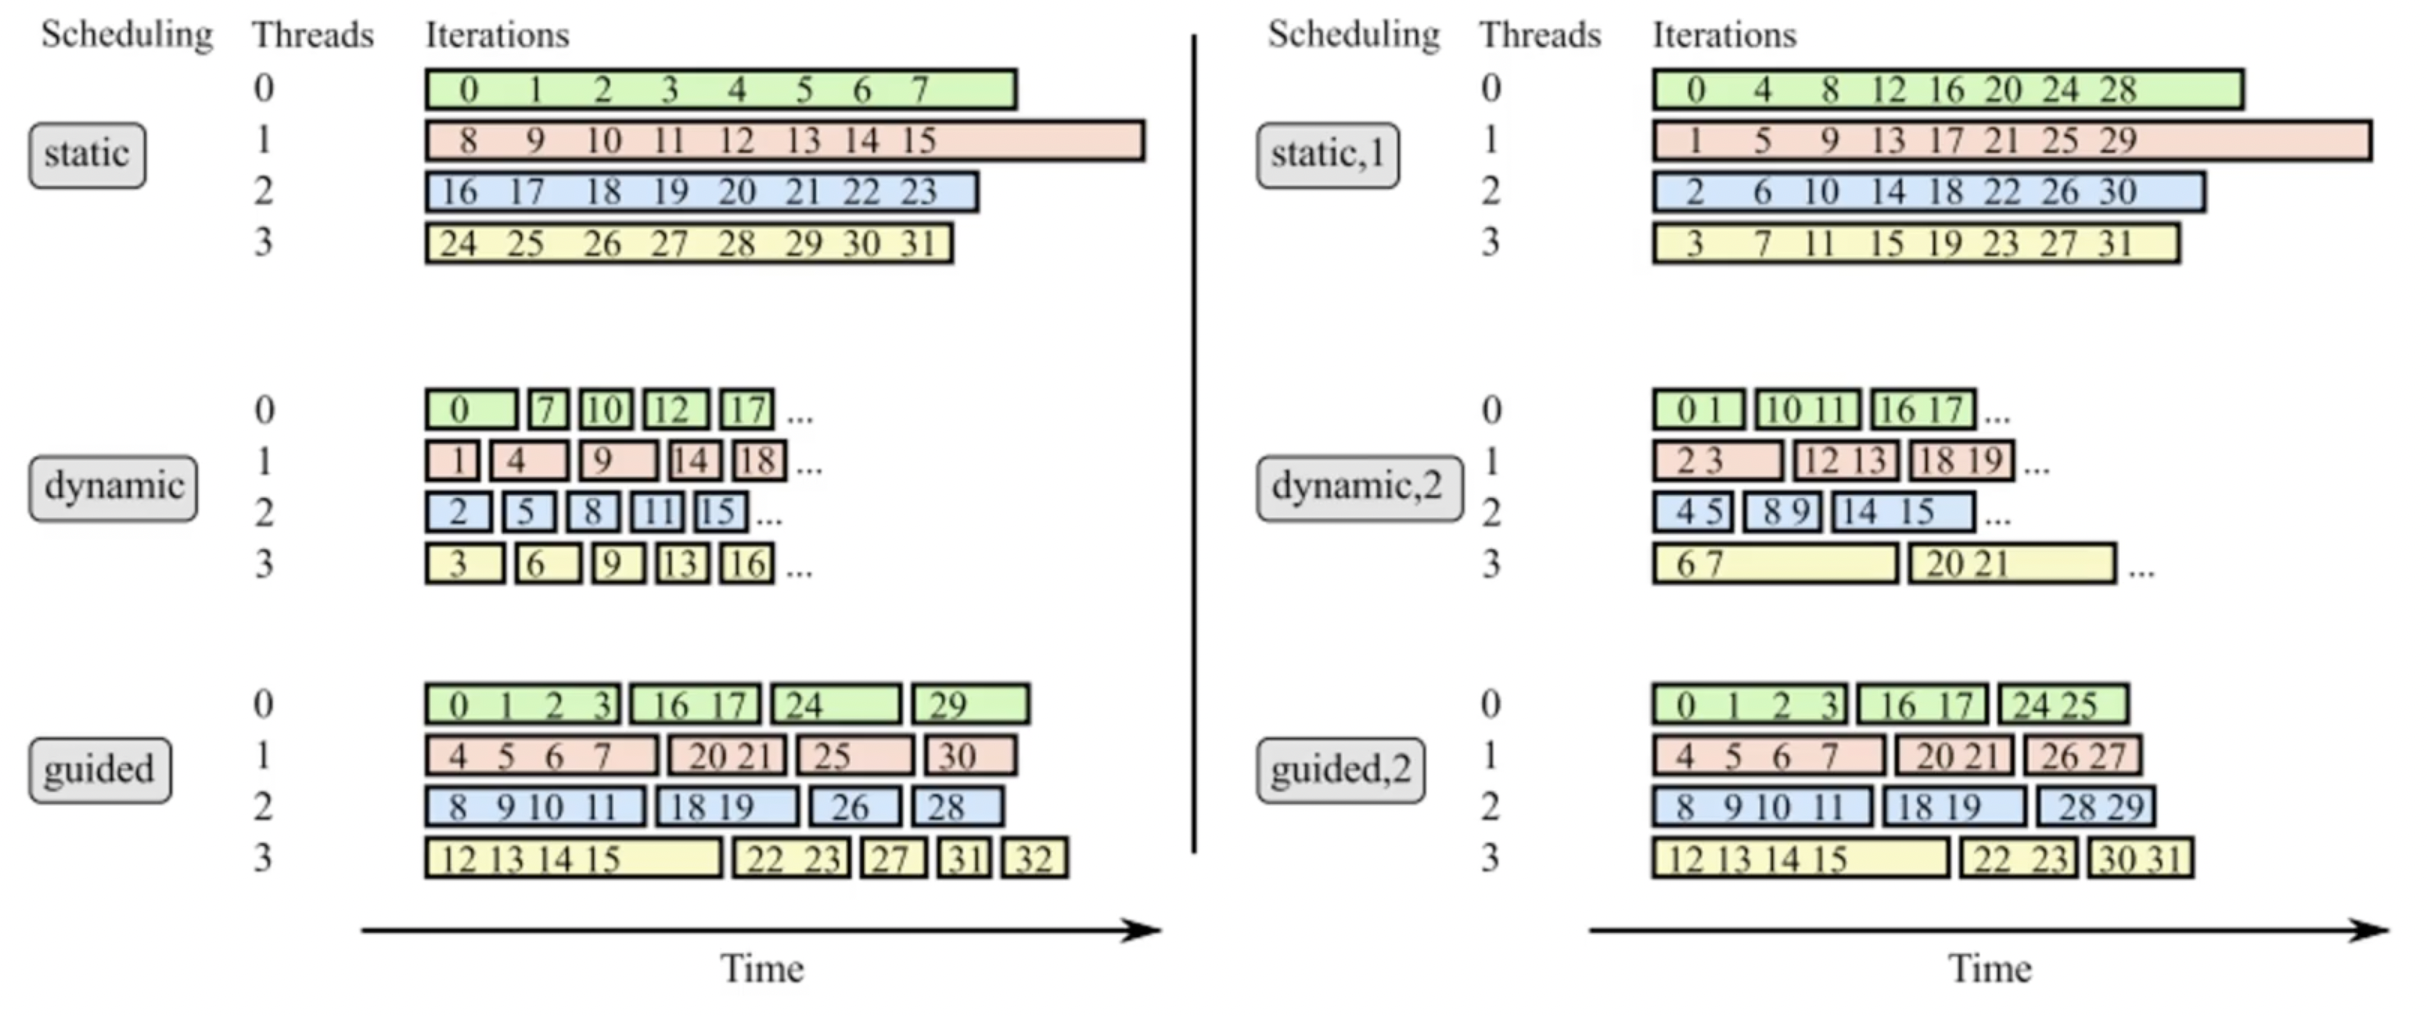
------------------------------------------------
| static | static | dynamic | dynamic | guided |
|    1   |    5   |    1    |    5    |        |
------------------------------------------------
|    0   |    0   |    0    |    2    |    1   |
|    1   |    0   |    3    |    2    |    1   |
|    2   |    0   |    3    |    2    |    1   |
|    3   |    0   |    3    |    2    |    1   |
|    0   |    0   |    2    |    2    |    1   |
|    1   |    1   |    2    |    3    |    3   |
|    2   |    1   |    2    |    3    |    3   |
|    3   |    1   |    0    |    3    |    3   |
|    0   |    1   |    0    |    3    |    3   |
|    1   |    1   |    0    |    3    |    2   |
|    2   |    2   |    1    |    0    |    2   |
|    3   |    2   |    1    |    0    |    2   |
|    0   |    2   |    1    |    0    |    3   |
|    1   |    2   |    2    |    0    |    3   |
|    2   |    2   |    2    |    0    |    0   |
|    3   |    3   |    2    |    1    |    0   |
|    0   |    3   |    3    |    1    |    1   |
|    1   |    3   |    3    |    1    |    1   |
|    2   |    3   |    3    |    1    |    1   |
|    3   |    3   |    0    |    1    |    3   |
------------------------------------------------
private vs firstprivate vs lastprivate
private variables are not initialised, i.e. they start with random values like any other local automatic variable
firstprivate initial the value as the before value.
lastprivate save the value to the after region. 这个last的意思不是实际最后运行的一个线程,而是调度发射队列的最后一个线程。从另一个角度上说,如果你保存的值来自随机一个线程,这也是没有意义的。
firstprivate and lastprivate are just special cases of private
#pragma omp parallel
{
   #pragma omp for lastprivate(i)
      for (i=0; i<n-1; i++)
         a[i] = b[i] + b[i+1];
}
a[i]=b[i];
private vs threadprivate
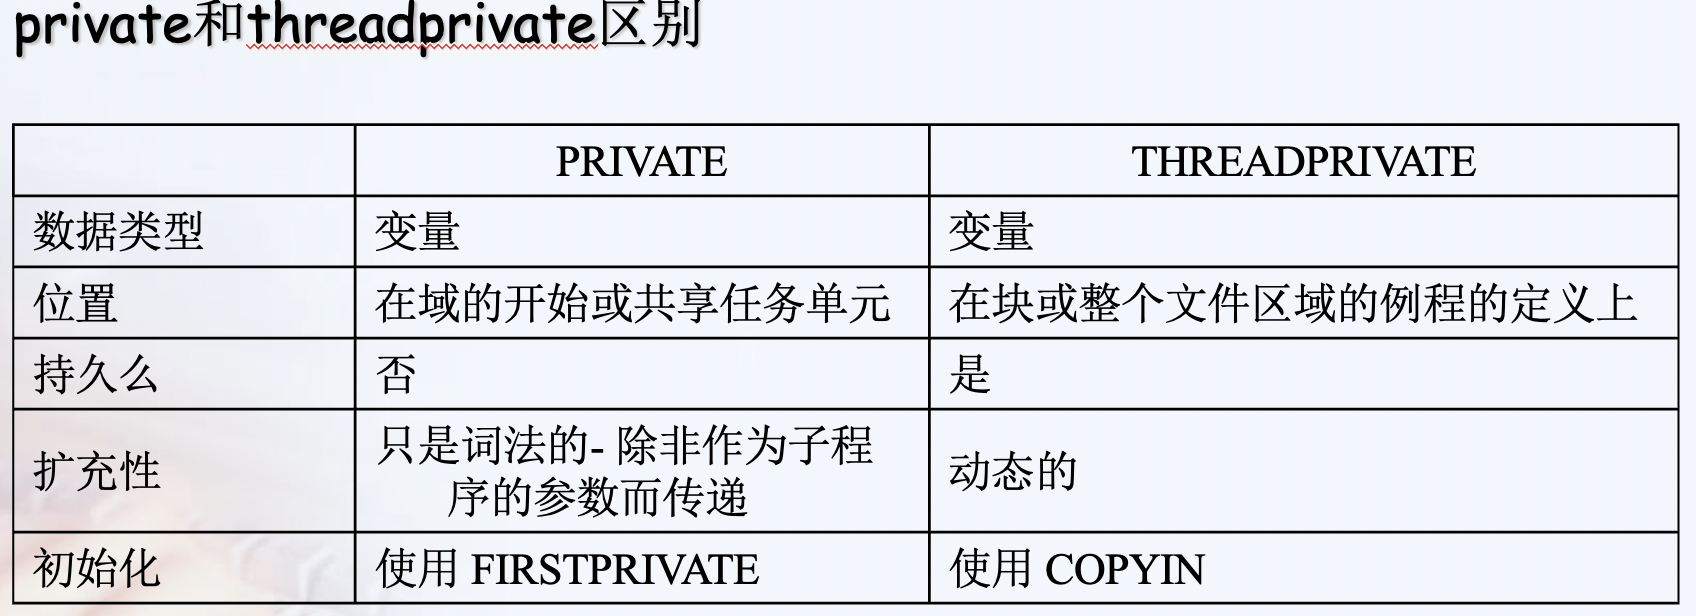
A private variable is local to a region and will most of the time be placed on the stack. The lifetime of the variable's privacy is the duration defined of the data scoping clause. Every thread (including the master thread) makes a private copy of the original variable (the new variable is no longer storage-associated with the original variable).
A threadprivate variable on the other hand will be most likely placed in the heap or in the thread local storage (that can be seen as a global memory local to a thread). A threadprivate variable persist across regions (depending on some restrictions). The master thread uses the original variable, all other threads make a private copy of the original variable (the master variable is still storage-associated with the original variable).
task 指令
可以指定某一task任务在指定第几个thread运行吗?
section 命令 与 for 命令的区别
简单理解sections其实是for的展开形式,适合于少量的“任务”,并且适合于没有迭代关系的“任务”。每一个section被一个线程去执行。
常用函数
omp_get_thread_num() //获取线程的num,即ID。在并行区域外,获取的是master线程的ID,即为0。
omp_get_num_threads/omp_set_num_threads()  //设置/获取线程数量,用于覆盖OMP_NUM_THREADS环境变量的设置。omp_set_num_threads在串行区域调用才会有效,omp_get_num_threads获取当前线程组的线程数量,一般在并行区域调用,在串行区域调用返回为1。
omp_get_max_threads() //返回OpenMP当前环境下能创建线程的最大数量。
环境变量
OMP_SCHEDULE:只能用到for,parallel for中。它的值就是处理器中循环的次数
OMP_NUM_THREADS:定义执行中最大的线程数
OMP_DYNAMIC:通过设定变量值TRUE或FALSE,来确定是否动态设定并行域执行的线程数
OMP_NESTED:确定是否可以并行嵌套
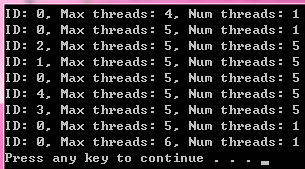
例子
#include <omp.h>

int main(int argc, _TCHAR* argv[])
{
    printf("ID: %d, Max threads: %d, Num threads: %d \n",omp_get_thread_num(), omp_get_max_threads(), omp_get_num_threads());
    omp_set_num_threads(5);
    printf("ID: %d, Max threads: %d, Num threads: %d \n",omp_get_thread_num(), omp_get_max_threads(), omp_get_num_threads());

#pragma omp parallel num_threads(5)
    {
        // omp_set_num_threads(6);  // Do not call it in parallel region
        printf("ID: %d, Max threads: %d, Num threads: %d \n",omp_get_thread_num(), omp_get_max_threads(), omp_get_num_threads());
    }

    printf("ID: %d, Max threads: %d, Num threads: %d \n",omp_get_thread_num(), omp_get_max_threads(), omp_get_num_threads());

    omp_set_num_threads(6);
    printf("ID: %d, Max threads: %d, Num threads: %d \n",omp_get_thread_num(), omp_get_max_threads(), omp_get_num_threads());

    return 0;
}
OpenMP和pthread是常见的模型
♦OpenMP为循环级并行提供了方便的功能。线程由编译器根据用户指令创建和管理。
♦pthread提供了更复杂、更动态的方法。线程由用户显式创建和管理。
需要进一步的研究学习
暂无
遇到的问题
暂无
开题缘由、总结、反思、吐槽~~
对子句和制导的关系不清楚
参考文献
https://blog.csdn.net/gengshenghong/article/details/7004594
https://docs.microsoft.com/en-us/cpp/parallel/openmp/reference/openmp-clauses?view=msvc-160
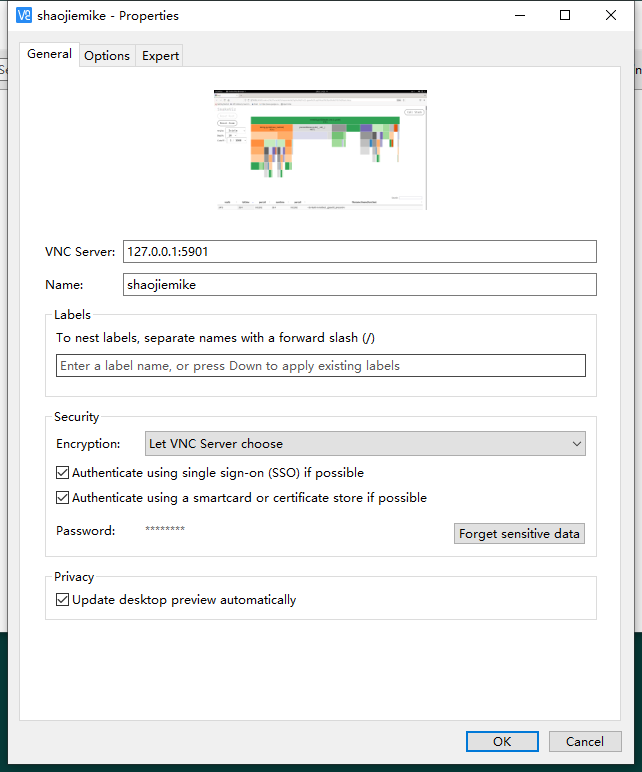
VNC
常用命令
# shaojiemike @ node5 in ~ [11:26:56]
$ vncserver -list

TigerVNC server sessions:

X DISPLAY #     RFB PORT #      PROCESS ID
:1              5901            148718 (stale)

# shaojiemike @ node5 in ~ [11:29:39]
$ vncpasswd
Password:

# shaojiemike @ node5 in ~ [11:34:08]
$ vncserver -kill :1
Killing Xtigervnc process ID 148718... which was already dead
Cleaning stale pidfile '/home/shaojiemike/.vnc/node5:1.pid'!

# shaojiemike @ node5 in ~ [11:36:15]
$ vncserver

New 'node5:2 (shaojiemike)' desktop at :2 on machine node5

Starting applications specified in /etc/X11/Xvnc-session
Log file is /home/shaojiemike/.vnc/node5:2.log

Use xtigervncviewer -SecurityTypes VncAuth -passwd /home/shaojiemike/.vnc/passwd :2 to connect to the VNC server.
客户端转发
需要进一步的研究学习
暂无
遇到的问题
暂无
开题缘由、总结、反思、吐槽~~
参考文献
无


LLVM Mca : huawei HiSilicon's TSV110 work
几个对比图
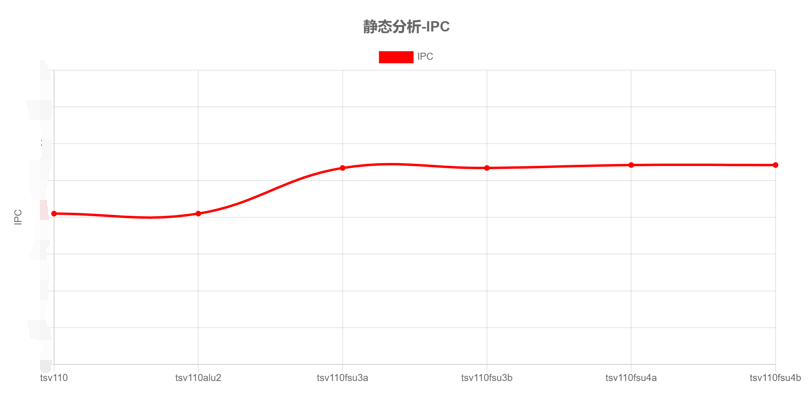
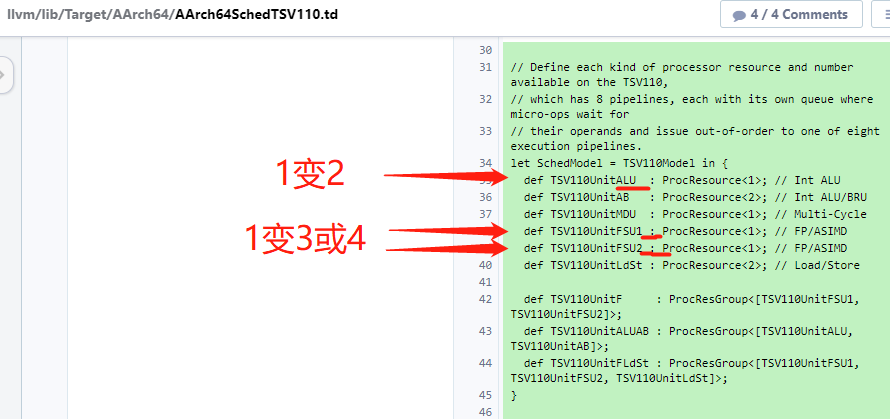
x轴的含义是改变port值的意思,比如tsv110alu2是在tsv110的基础上将alu的值改成2
相关的 git commit
commit c9ca3a3c66a493d72cf7afc7ee975e2de399f2e5
Author: Elvina Yakubova <[email protected]>
Date:   Sat Nov 7 01:50:43 2020 +0300

    [AArch64] Add driver tests for HiSilicon's TSV110

commit 93b99728b1676d23ab5dabc606344230d25e7f4b
Author: Elvina Yakubova <[email protected]>
Date:   Sat Nov 7 01:22:35 2020 +0300

    [AArch64] Add pipeline model for HiSilicon's TSV110

    This patch adds the scheduling and cost model for TSV110.

    Reviewed by: SjoerdMeijer, bryanpkc

    Differential Revision: https://reviews.llvm.org/D89972

commit 123553921f86ac0fad7b742740aa45e8d380be02
Author: Bryan Chan <[email protected]>
Date:   Fri Nov 9 19:32:08 2018 +0000

    [AArch64] Support HiSilicon's TSV110 processor

    Reviewers: t.p.northover, SjoerdMeijer, kristof.beyls

    Reviewed By: kristof.beyls

    Subscribers: olista01, javed.absar, kristof.beyls, kristina, llvm-commits

    Differential Revision: https://reviews.llvm.org/D53908

    llvm-svn: 346546
最近 Driver commit
复现上面的图
要改的地方
应该每次都要重新编译安装
测试的汇编代码
- 判断
llvm/test/MC/AArch64下的汇编能用吗?选个最大的,neon 不支持, armv8.2也并不支持。感觉有特别要求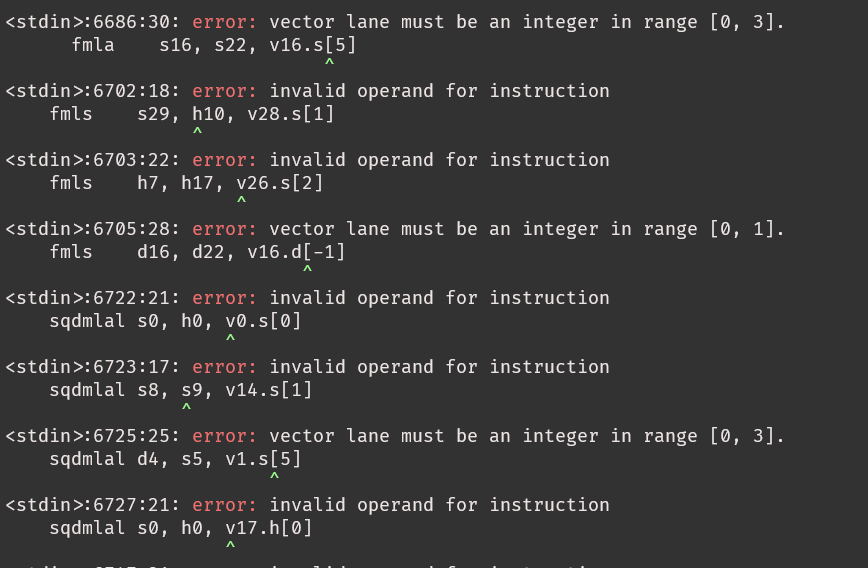
- 选择osaca的benchmark里的add.c
AArch64SchedTSV110.td
locate at llvm/lib/Target/AArch64/AArch64SchedTSV110.td
td file
tablegen(LLVM class) definitions
部分指令解释
BIC (bit clear) EON (Exclusive OR) ORR (OR operations on the values in Rn and Operand2)InstRW的定义
// Map a set of opcodes to a list of SchedReadWrite types. This allows
// the subtarget to easily override specific operations.
//
// SchedModel ties this opcode mapping to a processor.
class InstRW<list<SchedReadWrite> rw, dag instrlist> {
  list<SchedReadWrite> OperandReadWrites = rw;
  dag Instrs = instrlist;
  SchedMachineModel SchedModel = ?;
  // Allow a subtarget to mark some instructions as unsupported.
  bit Unsupported = false;
}
def TSV110Wr_2cyc_1MDU   : SchedWriteRes<[TSV110UnitMDU]>   { let Latency = 2; }

class SchedWriteRes<list<ProcResourceKind> resources> : SchedWrite,
  ProcWriteResources<resources>;

//定义TSV110上可用的每种处理器资源和数量,
//它有8条pipeline管道,每个管道都有自己的队列,微操作在那里等待
//它们的operands和issue将无序地发送到八个执行管道之一。
def TSV110UnitMDU  : ProcResource<1>; // Multi-Cycle
需要进一步的研究学习
暂无
遇到的问题
暂无
开题缘由、总结、反思、吐槽~~
参考文献
无
LLVM Mca :with BHive (2019)
BHive
一种新的profiler,可以profile没有用户干预的内存访问的基本块。
基于这种profiler创建了BHive,来验证llvm-mca等模型。
BHive是用来评价llvm-mca这些模型的,实验基于各种收集来的一个基本块各种评价
I. INTRODUCTION
Automatically Profiling Basic Blocks
困难在于现有的 没有考虑 memory crash ??? .默认命中L1 cache
A key technical challenge with collecting a large basic block dataset is that there is no existing approach to profile an arbitrary basic block that has been removed from its program context.
(没懂?那为什么要removed from its program context) 因为要把常用的应用拆成小例子来评判,这些模型的准确性。
原理
运用隐含狄利克雷分布LDA,基于cpu资源的利用率,来cluster benchmark suite里的基本块
通过对各种类型最基本的代码块来进行profile,从而形成针对各种performance model的数据库。
现在已经有超过30万的基本块分析,来源于各种方向的应用,包括数值计算OpenBLAS,数据库SQLite,机器学习TensorFlow,密码学OpenSSL。
这么多的数据产生了一个用于评估performance model的新benchmark。
作者说performance modeling 研究的未来在于与其他先进技术的大规模定量比较
内存访问的处理
通过把虚拟页面映射到单个物理页面,来合法内存访问同时避免cache miss
II. 背景
Existing Performance Models
有两种model 1. 产生可以详细描述指令何时发射和退休的可解释执行路径的微架构模拟器,附带吞吐量预测。 2. 每条指令都有延迟、吞吐量查找表,相当于一个被寄存器分配器使用的额外开销估计器
各种model, 写到另一篇里了
- IACA
- llvm-mca
- OSACA
- Ithemal
Machine Code Profilers
- 通过 Agner Fog’s script 测量真实的,有周期,cache miss 等等。https://www.agner.org/optimize/testp.zip
- nanoBench也是。https://github.com/andreas-abel/nanoBench 可以指定processor?和 kernel模式。
- Unrolling
- 测量吞吐量的基本方法就是展开一个基本块的代码多次,然后测重复多次的代码。把展开的基本块latency除以
unroll factor(典型值是100) - 目的:
- 边缘化前几次warm up的latency值的影响。
- 减少收起数据的开销影响
unroll factor就是循环展开次数。- 局限性是,必须人工给代码块,不能自动profile一堆任意的基本块来系统性验证。???
III. PROFILING ARBITRARY BASIC BLOCKS
目标是在不需要手动干预的情况下分析任意基本块,以便测量的吞吐量与性能模型通常假定的定义和不变量相对应。关键的挑战是使这些基本块能够在不崩溃的情况下访问任意内存地址。
由于基本块只是正常程序的一部分,导致根本不能单独正常运行。BHive做的事情就是,让他正常运行。
Handling Arbitrary Memory Accesses
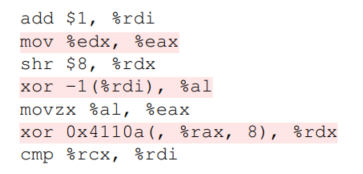 这个代码块只有执行代码分配在
0x4110a时,才能正常运行
1. Remapping Virtual Pages.
1. 一个基本块的所有虚拟内存页重新映射到一个物理页上,所以全部数据访问都命中L1。这样就可以执行97%的基本块。
2. 步骤
1. 把原本虚拟页全部unmap
1. 这会导致除了包含基本块指令的页之外的全部的连续的内存访问出问题???
2. 在子进程里运行展开的基本块指令。
1. 这时对每个unmap的虚拟页的访问都会出错,但是主进程一种监视着。一旦中断就重新映射出错地址,然后重新开始跑。
2. Memory Initialization
1. 初始化一个中等大小0x12345600的物理页,允许都虚拟页都映射
3. Virtual page aliasing
1. 因为不同的虚拟页映射在同一个物理页的同一项导致memory dependences,要等待
2. 剔除6.28%的基本块
3. 可以通过增大物理页,来减小发生的概率。
Overall Profiling Workflow
通过重复运行基本块来计算吞吐量
1. Raw Measurement
1. 先从基本块里,产生不会memory crash的可执行部分。
2. unroll factor的选取。It uses 100 and 200 as the unroll factors for basic blocks smaller than 100 bytes; 50 and 100 for basic blocks between 100 bytes and 200 bytes; and finally 16 and 32 for basic blocks larger than 200 bytes
2. Filtering
1. 筛选执行代码满足理想化模型的执行结果,比如命中L1cache
2. L1 Cache Misses
1. 工具可以用硬件计数器监控指令和数据cache misses。拒绝所有cache miss的情况。
3. Unaligned Loads
1. 不连续的访存会很慢,解决方法就是去除所有有不连续的访存的。大约删除了0.18%的基本块
4. Subnormal Floating Point
1. 一些特殊的浮点数计算会比正常的浮点数计算慢20倍,去除了与MXCSR寄存器有关的0.1%的基本块。
2. https://stackoverflow.com/questions/8341395/what-is-a-subnormal-floating-point-number
5. Context Switches
1. 上下文切换(英语:context switch),又称环境切换,电脑术语,是一个存储和重建CPU的状态 (内文),因此令多个进程(process)可以分享单一CPU资源的计算过程。要切换CPU上的进程时,必需先行存储目前进程的状态,再将欲运行的进程之状态读回CPU中。
6. 可接受的评估公式 10%的误差???
3. Throughput Calculation
1. 如果通过了基本块的筛选,用有记录的最小延迟计算吞吐量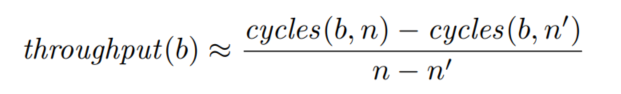 4. Environment Variance
1. 由于环境的影响,导致结果有个稳定的偏移。至少执行5次,展开16次的基本块。取最小的5次作为结果。
4. Environment Variance
1. 由于环境的影响,导致结果有个稳定的偏移。至少执行5次,展开16次的基本块。取最小的5次作为结果。
Portability to Other Architectures
只要架构满足以下几点要求 1. 有将多个虚拟页面映射到几个物理页面的API。map multiple virtual pages to a few physical pages 1. without incurring a performance penalty due to unnecessary cache invalidation. We therefore require that the target processor has a physically tagged data cache(VIPT)??? 1. we additionally require that the page size is small enough so the indexing bits are not affected by address translation. 1. detecting cache misses, 2. and detecting or disabling floating-point underflow.
IV. BASIC BLOCK DATASET
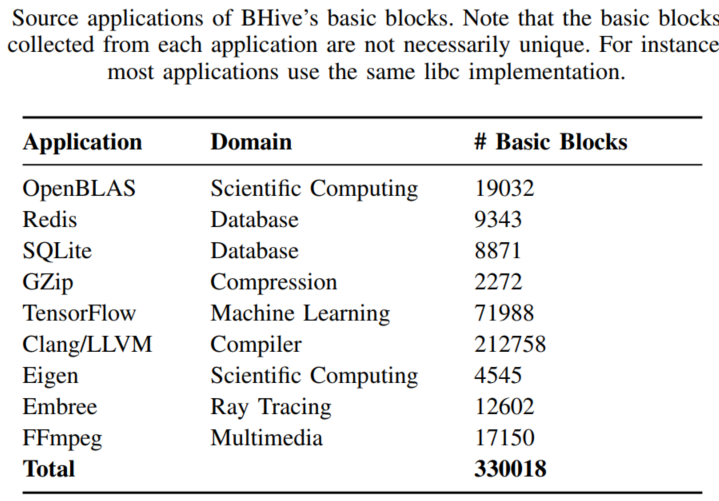
应用的选择
- 尽可能还原现实生活的各个方面,
- 而且是用户的典型用法。
- Clang/LLVM (compiler), Redis (inmemory database), SQLite (database), and Gzip 是用高级语言C或者C++编写的,算法和数据结构有复杂的设计。
- OpenSSL (cryptography), OpenBLAS , Eigen (scientific computing),TensorFlow (machine learning) 代表的是核心循环是手动汇编优化过的高性能库。
- 其中Embree是 用Intel ispc (a data-parallel language)编写的。
We compiled all applications with the highest optimization settings defined by their build systems. 如果可以用上了AVX2。
使用DynamoRIO动态分析来提炼基本块。可以实现在运行时记录每个运行的基本块。我们采用动态分析,而不是静态反汇编。因为静态反汇编无法区别padding bytes from instructions。???
应用的例子除了FFmpeg and Gzip都是选择的官方的benchmark。 Eigen 采用的是 two sparse linear algebra workloads: sparse matrix-matrix multiplication (SpMM) and sparse matrix-vector multiplication (SpMV).
V. BASIC BLOCK CLUSTERING
一些基本块比其他的更难建模,???(建什么模,VI-B说明了什么)有内存依赖的基本块预测错误率更高。
采用了一种技术???(是应用在提取上) 基于处理器的使用聚类基本块。 这个技术有助于性能模型的设计和使用者更细粒度了解performance model,让他们能集中以后新添加的资源在有困难的那一类基本块。
- Methodology
- 具体方法
- 找到每个基本块的硬件使用率的表示 port-mapping representation
- 根据其聚类
- 对每条指令结合port使用
- 运用 Abel and Reineke A. Abel and J. Reineke, “uops.info: Characterizing latency, throughput, and port usage of instructions on intel microarchitectures,” in ASPLOS, 2019的结果 ???
- 例如???
xor %rax, %rbxin Haswell is{p0156 → 1}
- 使用Latent Dirichlet Allocation (LDA)来构建topic model 模型(python 训练模型)
- 在语言处理上的应用是基于统计词频
- 在实际运用的时候,微指令操作会根据使用的port而有小不同。
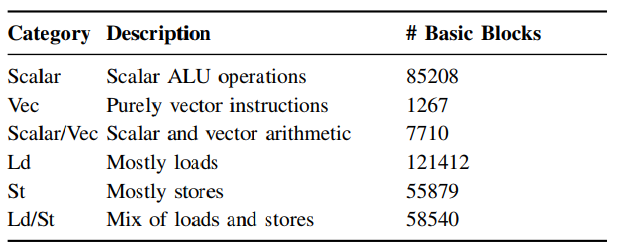
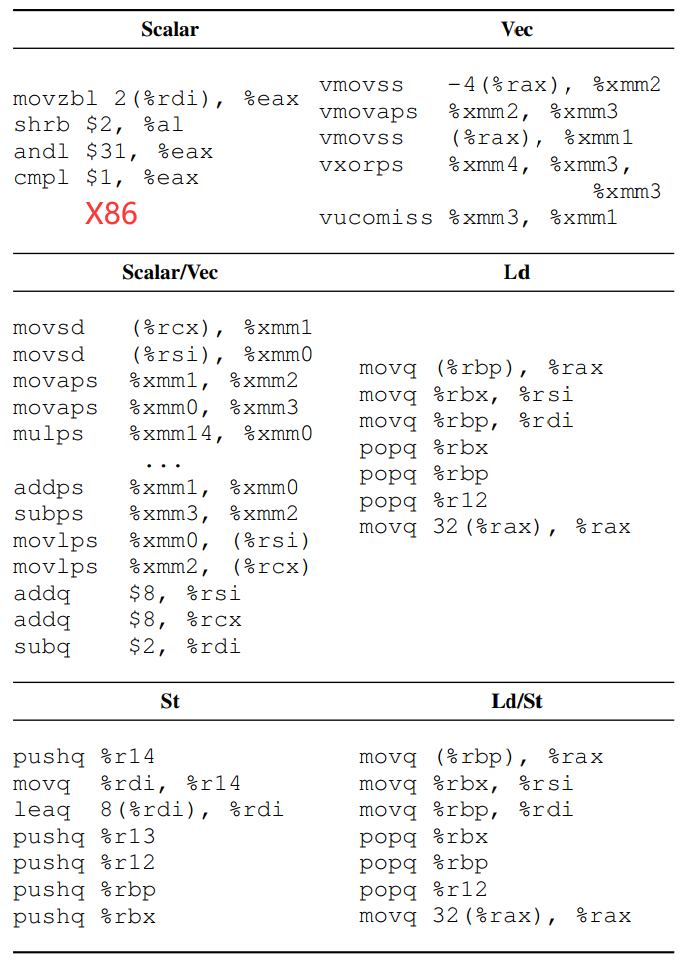
- topics是分类的类别,6类
- documents是基本块
- α = 1/6 and β = 1/13.
- 为了推断每个微指令操作所属的类别,我们使用了SciKit Learn transform对于LDA的随机变化推断的默认实现
- 计算每个基本块的最有可能的类别作为其分类结果
- Results
- LDA将结果聚类后,根据基本块的内容,手动进行注名以及说明
- example
- 根据运行时频率确定其权重, 基于sample-based profiler??? (A portable sampling-based profiler for java virtual machines,)确定。
- 高性能的库如预期一样,向量化的基本块占比较多。
- 其余的无向量化的较多。OpenSSL and Gzip有许多位操作的。
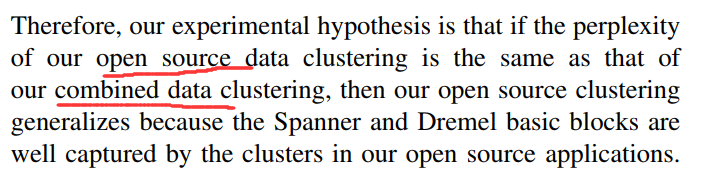
- Case Study on Data-Center Applications
- 目的:作为测试例子,看这个聚类方法能不能找得到隐藏的热点、工作负载
- Methodology
- 第一步:首先将其基本块分成之前的几类,还是使用LDA
- 第二步:分类结果标注
- 第三步:比较聚类结果的perplexity值???
- ???有没有结合google的应用
- Results
- 添加新应用后,该值只是略微增长。说明模型的代表性好。???
VI. PERFORMANCE MODEL EVALUATION
在3种Intel架构上验证4种已有的性能模型
1. Methodology
1. 说明各个测试软件的版本。
2. Dataset
1. basic block dataset discussed in Section IV
3. Platform
1. balabala 3种架构的 Intel cpus
4. Evaluation Metrics
1. 测量吞吐量t和预测吞吐量t'$\(err(t,t')=|\frac{t-t'}{t}|\)$
2. 不以预测精度,而是以预测结果的相对关系为评分标准。
5. 额外能评估每个模型如何保持基本块吞吐量的顺序。使用Kendall’s tau系数(越大效果越好),而不是相对误差。测量的原因是使用者可能关心的不是绝对的数值精度,而是相对关系的准确率。比如优化软件的时候关心的不是具体耗时,而是哪个优化策略耗时更短。
2. Results
1. 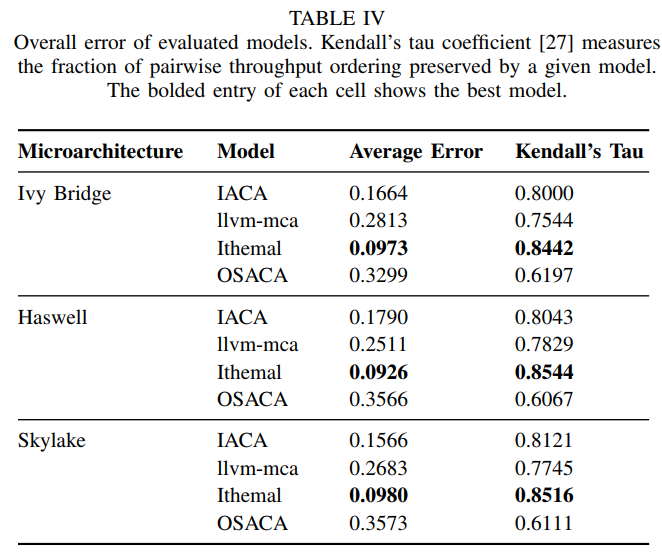 2. IACA 第二好的,在向量化类模拟的最好
3. llvm-mca 最差的,尤其是和loads有关时。
4. Ithemal 除了向量基本块都是最好的。在memory dependence (Ld/St)尤其好,但是向量基本块不好,可能与训练集没有向量基本块有关。
5. OSACA 第三。由于还在开发中,使用还遇到5个bug。在遇到一些不认识的指令的时候,会直接按照nops空指令处理。
3. Examples of Modeling Bugs
2. IACA 第二好的,在向量化类模拟的最好
3. llvm-mca 最差的,尤其是和loads有关时。
4. Ithemal 除了向量基本块都是最好的。在memory dependence (Ld/St)尤其好,但是向量基本块不好,可能与训练集没有向量基本块有关。
5. OSACA 第三。由于还在开发中,使用还遇到5个bug。在遇到一些不认识的指令的时候,会直接按照nops空指令处理。
3. Examples of Modeling Bugs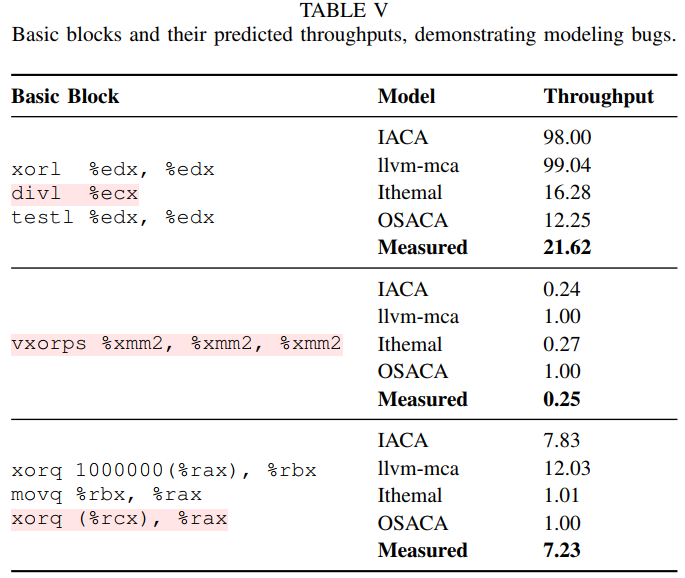 1. 最后一个例子是由于模型错误调度微指令导致的
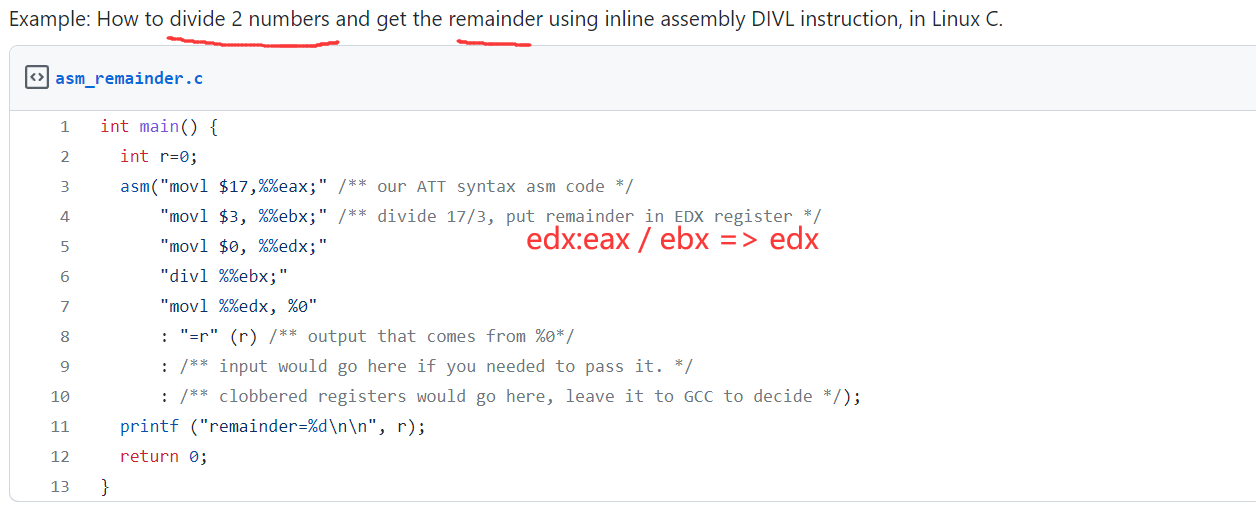
2. Modeling bug due to unsigned division
1. 例子是 a 64-bit by 32-bit unsigned division.
1. 最后一个例子是由于模型错误调度微指令导致的
2. Modeling bug due to unsigned division
1. 例子是 a 64-bit by 32-bit unsigned division.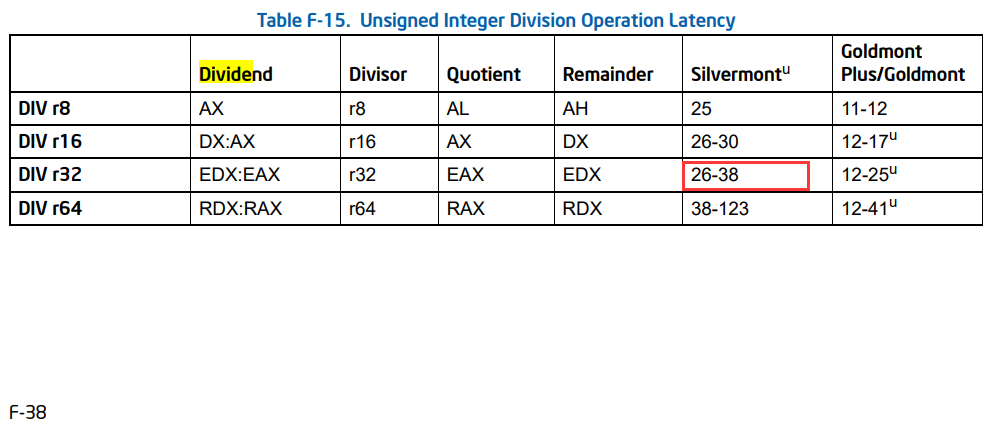

 2. ???
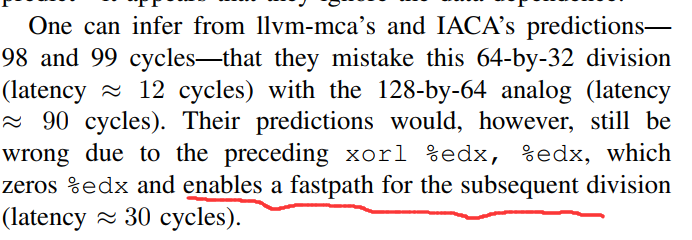 3. Modeling bug due to zero-idioms
1.
3. Modeling bug due to zero-idioms
1.  2. 对这种结果固定的特殊指令的快速处理。
4. Modeling bug due to mis-scheduling
1. 对于数据依赖,上下指令的寄存器有写后读。
2. Ithemal’s and OSACA忽略了该依赖
3.
2. 对这种结果固定的特殊指令的快速处理。
4. Modeling bug due to mis-scheduling
1. 对于数据依赖,上下指令的寄存器有写后读。
2. Ithemal’s and OSACA忽略了该依赖
3. 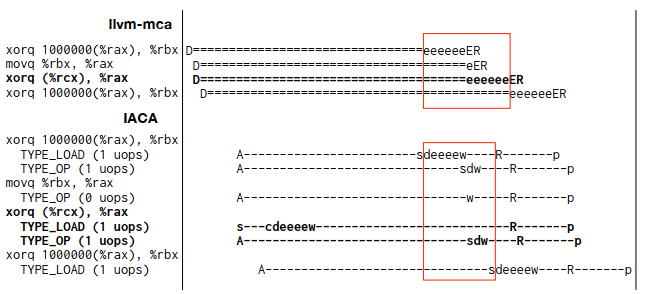 4. llvm-mca 没有注意到(%rcx)是memory,没有依赖可以提前发射。
CONCLUSION
现有的静态分析器对内存依赖和向量化块的建模还有困难。
github代码说明
benchmark/sources下是各种软件的各个部分的16进制基本代码块和其出现概率,用csv格式(逗号分隔值 (Comma-separated values))存储benchmark/throughput是在各种架构下的各基本块的测量吞吐量,单位cycles per hundred-iterations.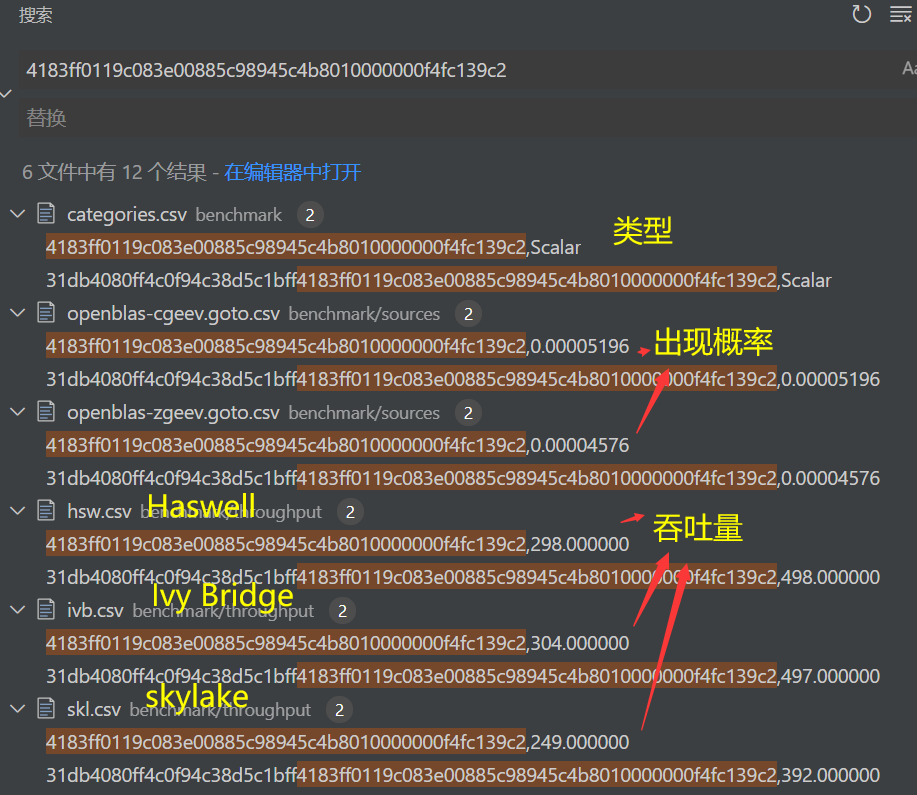
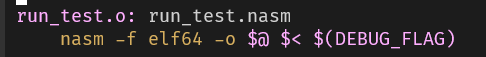
benchmark/disasm可以把16进制代码通过nasm变成汇编,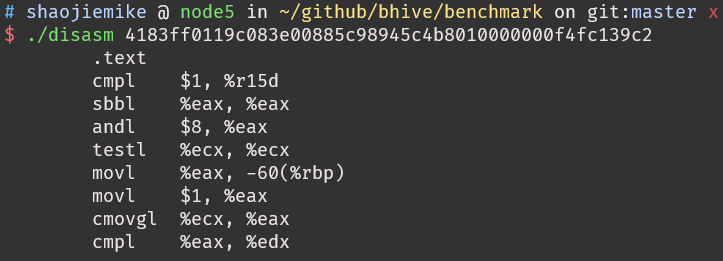
timing-harness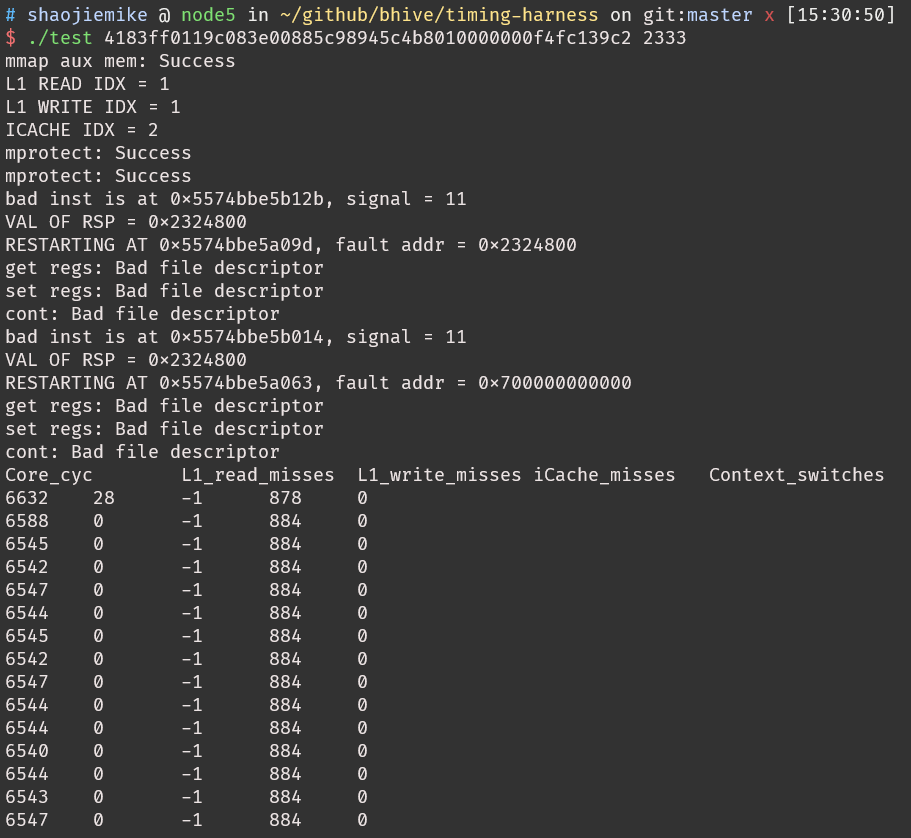
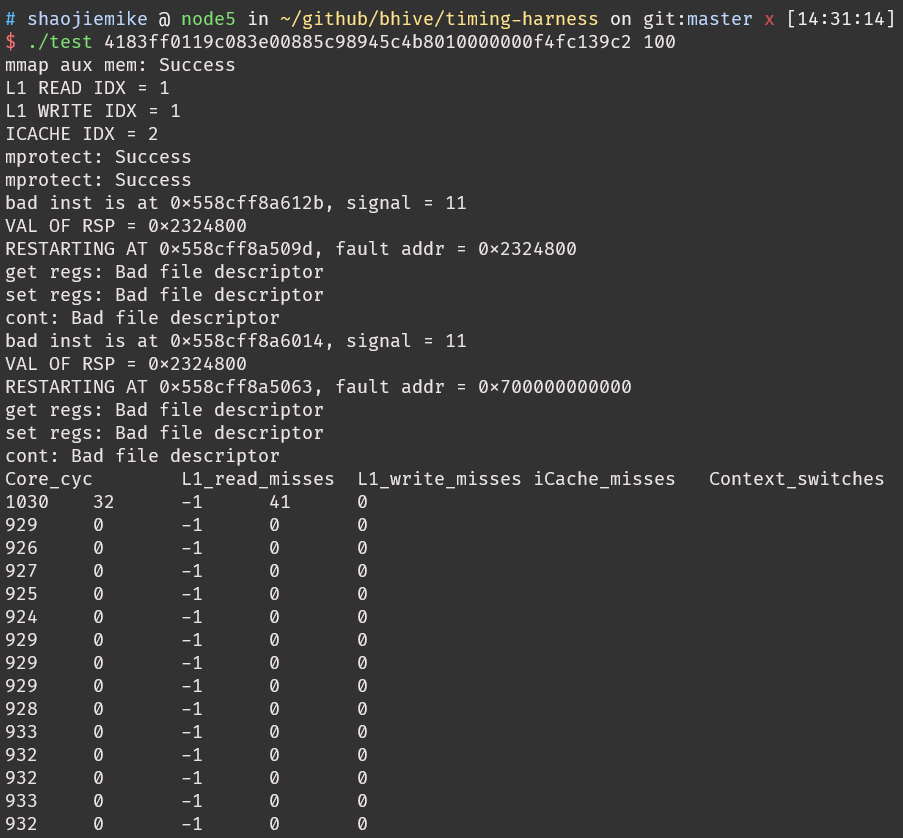 吞吐量的计算(猜的)Skylake microarchitecture$\(\frac{6632-1030}{2333-100}*100=250.8 (cyc/hundred\ iters)\)$
BHive 被质疑的局限性
uops 的文章, Accurate Throughput Prediction of Basic Blocks on Recent Intel Microarchitectures
4.2 Extending BHive
BHive 运行逻辑
- 读入16进制代码和循环次数
hhex2bin转换为二进制create_shm_fd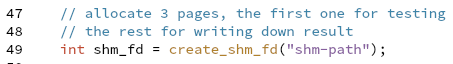
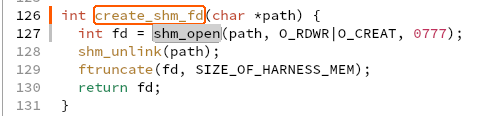
-
shm_open, shm_unlinkcreates and opens a new, or opens or unlink an existing, POSIX shared memory object.O_RDWROpen the object for read-write access.O_CREATthe shared memory object if it does not exist.777是类似文件读写执行组权限的东西 On success, shm_open()returnsa file descriptor (a nonnegative integer) -
POSIX可移植操作系统接口The Portable Operating System Interface 是IEEE为要在各种UNIX操作系统上运行软件,而定义API的一系列互相关联的标准的总称。 ftruncate— truncate截短 a file to a specified length-
define SIZE_OF_HARNESS_MEM (4096 * 3)
measure开始测量- int fds[2] ???
pipe用于创建pipe,用来进程间通信的单向数据通路,传入变量用来返回引用自pipe末端的文件描述符file descriptors。第一个指向the read end of the pipe,第二个指向the write end of the pipemmap(void *addr, size_t length, int prot, int flags,int fd, off_t offset); munmap(void *addr, size_t length);- map or unmap files or devices into memory 在调用进程的虚拟地址空间里create a new mapping.- fork()产生子进程
- fork()原理详解
- 复制之前的一模一样。
- fork() returns a zero to the newly created child process.
- fork() returns a positive value, the process ID of the child process, to the parent.
- 父进程
-
define OFFSET_TO_COUNTERS 32
- 为什么声明一个偏移地址指针???
- struct pmc_counters 由5个uint64_t组成。 uint64 will always take 8 bytes。一个结构体40bytes
attach_to_child(pid, fds[1]);pid是子进程pidptrace(enum __ptrace_request request, pid_t pid,void *addr, void *data)- process trace 提供一种进程tracer跟踪控制另一个进程tracee的方法,可以修改被控制者的memory and registers.PTRACE_SEIZEAttach to the process specified in pid, making it a tracee of the calling process. Unlike PTRACE_ATTACH, PTRACE_SEIZE does not stop the process- 子进程从fds[0]里读到x里,父进程把x的值写入 fds[1] ???
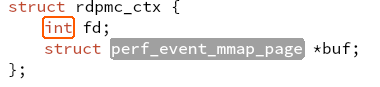
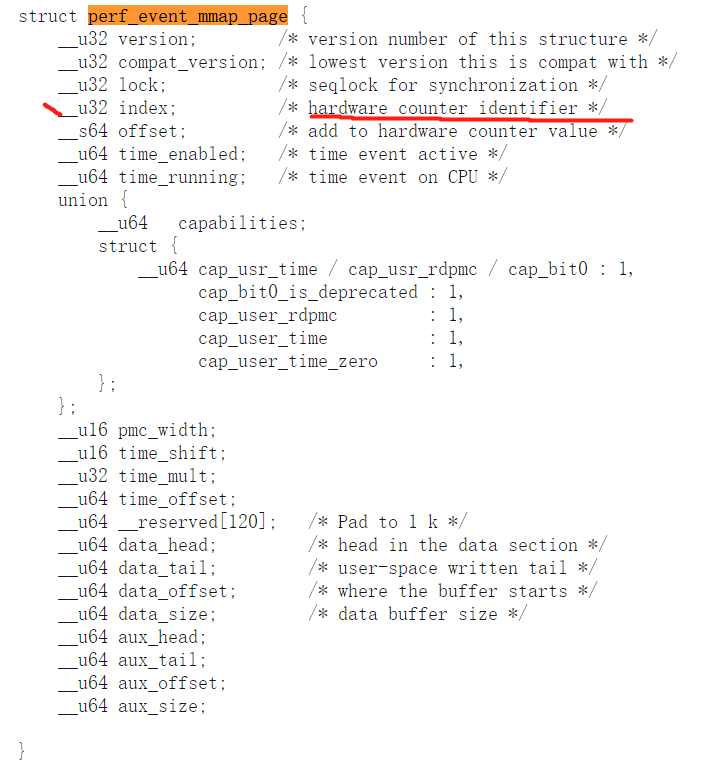
- check Performance Monitoring Counters (PMCs) supports
rdpmc_open_attrinitialize a raw ring 3 ReaDable PerforMance Counter
- last_failing_inst 和 mapping_done
- To kill child
-
define MAX_FAULTS 1024 # 子进程产生的错误需要解决?
wait挂起当前线程,直到有一个children结束,返回其PIDWIFEXITEDWait_IF_EXITED 判断是否正常结束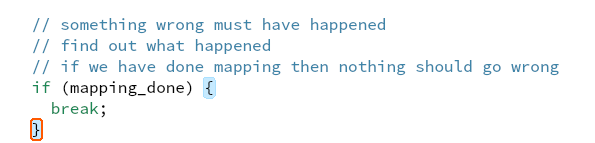
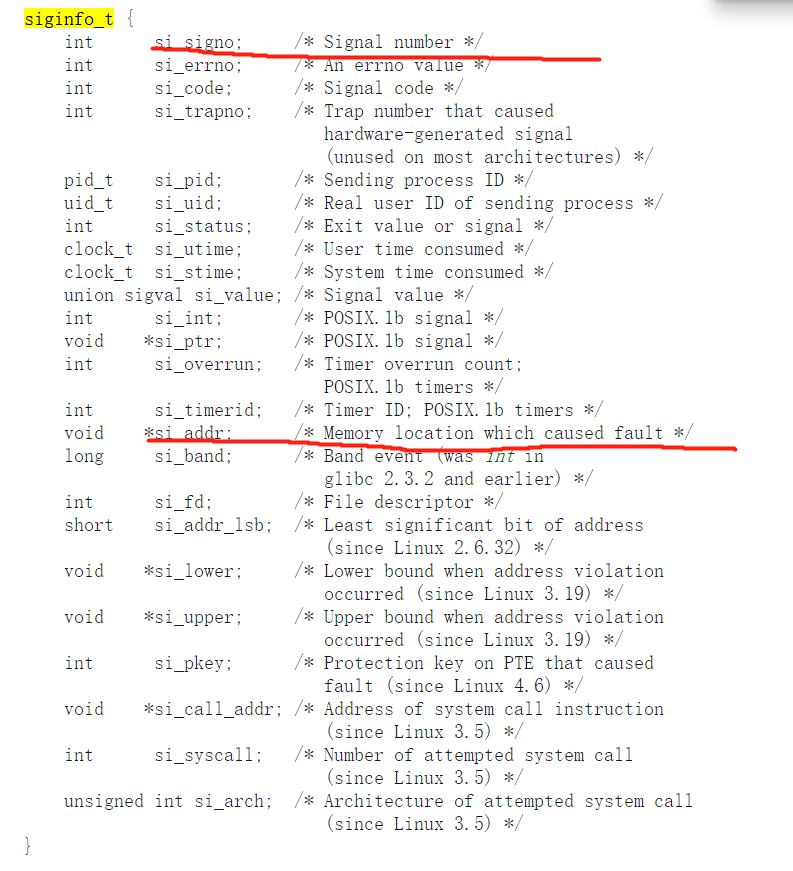
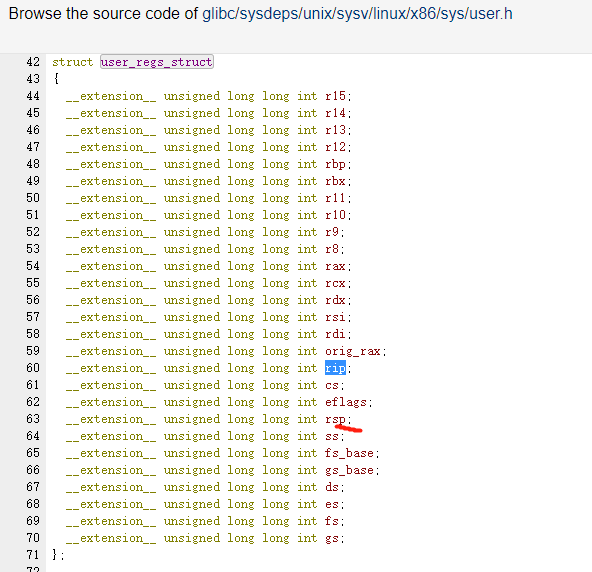
- 如果错误打印出错信号(eg.11)指令指针寄存器RIP,指针寄存器RSP
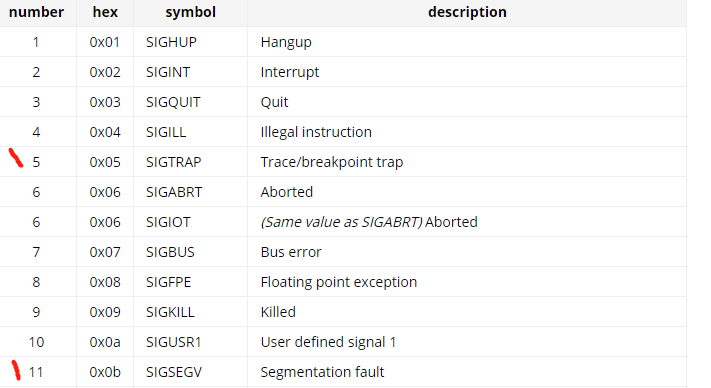
- 函数是用汇编写的就离谱
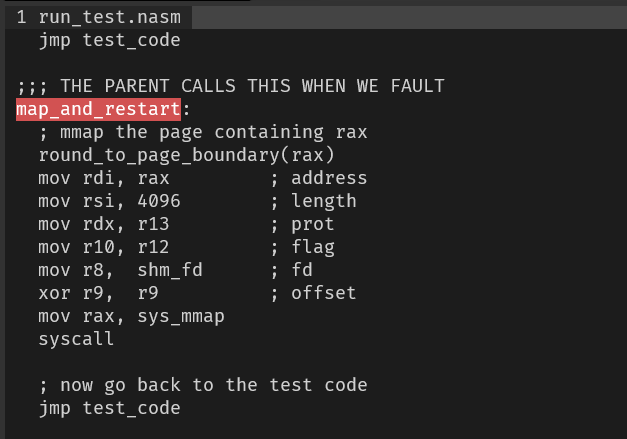
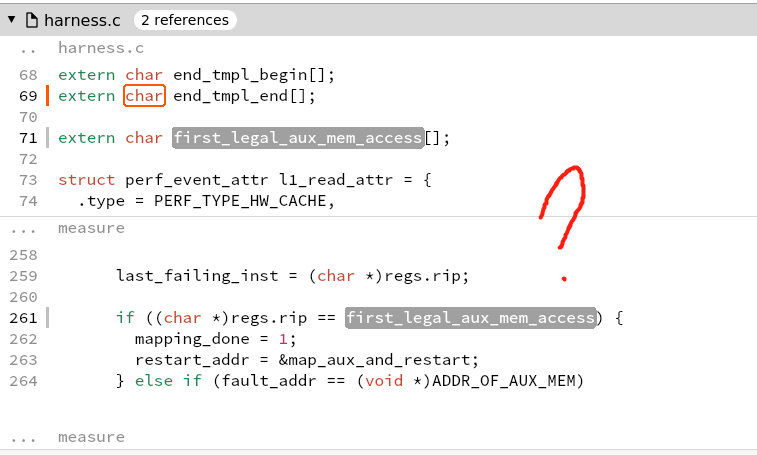
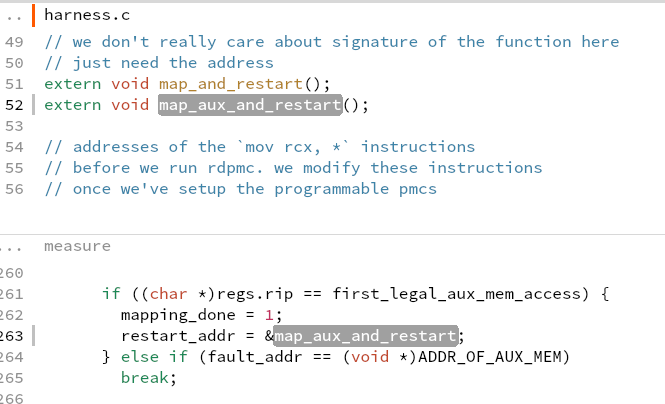 what is aux mem?
 - 修改出错地方的寄存器,重新运行
PTRACE_CONTRestart the stopped tracee process - 最多执行MAX_FAULTS次
-
- 最后父进程杀死子进程
-
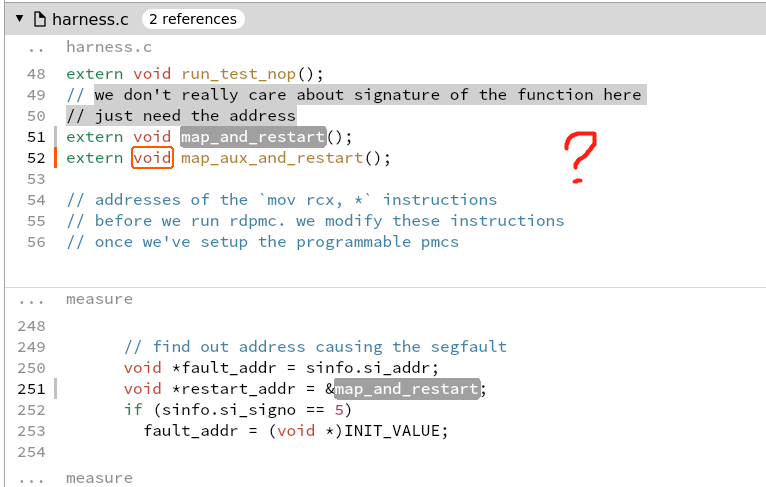
- 子进程
- 父进程测试是否支持PMCs,子进程使用
- harness.c :277
- 父进程测试是否支持PMCs,子进程使用
- fork()原理详解
https://www.cnblogs.com/from-zero/p/13750852.html
需要进一步的研究学习
暂无
遇到的问题
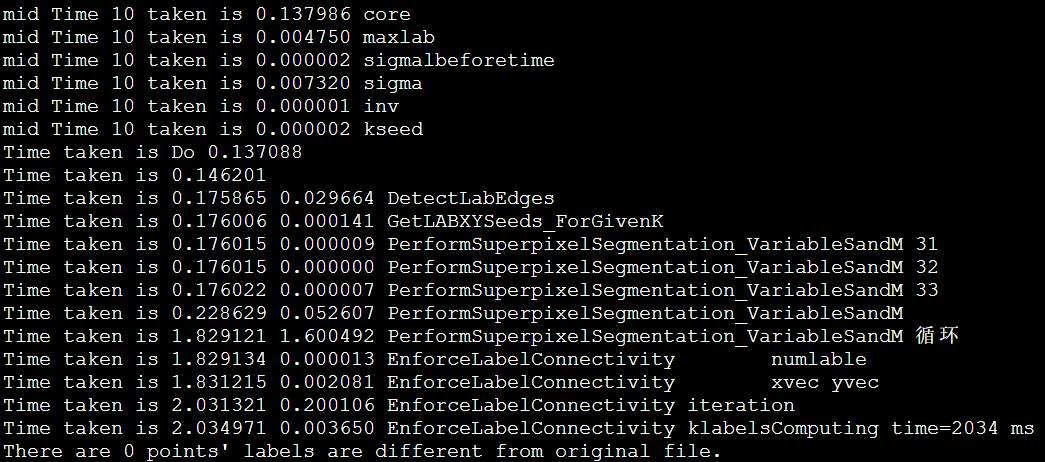
- time 怎么算的the latency of the basic block?为什么打印15个呢?
- 还有中间的错误是怎么回事?
- 论文里的误差怎么算的?
- BHive整合了几个软件(整合了什么呢),应该是真实测量了得出真实吞吐量?还是也是模拟的?
- 和uops比怎么样
- 哪个数据是准确的,是BHive模拟的,还是真实测量的。
- 通过 Agner Fog’s script 测量真实的,有周期,cache miss 等等。https://www.agner.org/optimize/testp.zip
- nanoBench也是。https://github.com/andreas-abel/nanoBench 可以指定processor?和 kernel模式。
- 局限性是,必须人工给代码块,不能自动profile一堆任意的基本块来系统性验证。???
- BHvie的代码实现,移植到鲲鹏,然后根据PMU调准。
问题是x86的二进制或者汇编不能变成aarm64的二进制或者汇编。
开题缘由、总结、反思、吐槽~~
参考文献
https://github.com/ithemal/bhive
LLVM-MCA: Install&RunTests
github
https://github.com/llvm/llvm-project/tree/main/llvm/tools/llvm-mca
Quick Start
安装
下载可执行文件上传服务器,解压
安装遇到的问题
- cannot find libtinfo.so.5
- sudo apt install libncurses5
- ln -s /usr/lib/libncursesw.so.6 /usr/lib/libtinfo.so.5 或者类似的 ln -s /usr/lib/libncurses.so.5 /usr/lib/libtinfo.so.5
- 在/snap/core下找到了,但是这是什么目录?是之前Ubuntu的包管理工具,但是已经不用了。
从源码安装
node5
由于之后要写代码的,还是从头安装更好。
cd llvm-project
mkdir build
cmake -S llvm -B build -G "Unix Makefiles" -DLLVM_ENABLE_PROJECTS="clang;llvm-mca" -DCMAKE_INSTALL_PREFIX="~/Install/llvm" -DCMAKE_BUILD_TYPE=Debug -DLLVM_ENABLE_ASSERTIONS=On
cd build
make -j32
make install
kunpeng
cmake -S llvm -B build -G "Unix Makefiles" -DLLVM_ENABLE_PROJECTS=all -DCMAKE_INSTALL_PREFIX="~/Install/llvm" -DCMAKE_BUILD_TYPE=Debug -DLLVM_ENABLE_ASSERTIONS=On
#change cmake or -DLLVM_ENABLE_PROJECTS="all"
g++: error: unrecognized command line option ‘-mllvm’
g++: error: unrecognized command line option ‘--tail-merge-threshold=0’
g++: error: unrecognized command line option ‘-combiner-global-alias-analysis’
cmake -S llvm -B build -G "Unix Makefiles" -DLLVM_ENABLE_PROJECTS="clang;llvm-mca" -DCMAKE_INSTALL_PREFIX="~/Install/llvm" -DLLVM_TARGETS_TO_BUILD=AArch64 -DCMAKE_BUILD_TYPE=Debug -DLLVM_ENABLE_ASSERTIONS=On
使用
由于不是X86,llc --version 查看到target是 aarch64-unknown-linux-gnu
clang /home/shaojiemike/Download/llvm-project-main/lldb/test/API/lang/c/forward/foo.c -O2 -target aarch64-unknown-linux-gnu -S -o -|llvm-mca -timeline -show-encoding -all-stats -all-views
可以看出是用TSV110Unit的port,默认cpu是tsv110
名词解释
ALU/BRU
算数逻辑单元 ALU 负责处理整数运算指令. 跳转处理单元BRU 负责处理跳转指令. BRU 可以与 ALU 合并, 复用 ALU 的逻辑来计算跳转指令的条件和跳转地址, 也可以作为一个单独的功能单元接入到流水线中.
MDU
乘除法单元 MDU (mult-divide unit)
需要进一步的研究学习
- llvm-mca微指令怎么实现的,怎么把汇编变成微指令
- 在view里加memory的实现
- 考虑了cache命中等影响 https://github.com/andreas-abel/uiCA uops
- 鲲鹏架构 https://bbs.huaweicloud.com/community/usersnew/id_1513665626477516
遇到的问题
llvm-mca -mcpu=help竟然会卡住,不知道为什么- 所以说是华为已经写了一个叫tsv110的,实现2个功能?
开题缘由、总结、反思、吐槽~~
参考文献
无
样例输出
Iterations:        100
Instructions:      200
Total Cycles:      70
Total uOps:        200

Dispatch Width:    4
uOps Per Cycle:    2.86
IPC:               2.86
Block RThroughput: 0.5


No resource or data dependency bottlenecks discovered.


Instruction Info:
[1]: #uOps
[2]: Latency
[3]: RThroughput
[4]: MayLoad
[5]: MayStore
[6]: HasSideEffects (U)
[7]: Encoding Size

[1]    [2]    [3]    [4]    [5]    [6]    [7]    Encodings:                    Instructions:
 1      1     0.33                         4     20 00 80 52                   mov  w0, #1
 1      1     0.50                  U      4     c0 03 5f d6                   ret


Dynamic Dispatch Stall Cycles:
RAT     - Register unavailable:                      0
RCU     - Retire tokens unavailable:                 0
SCHEDQ  - Scheduler full:                            0
LQ      - Load queue full:                           0
SQ      - Store queue full:                          0
GROUP   - Static restrictions on the dispatch group: 0


Dispatch Logic - number of cycles where we saw N micro opcodes dispatched:
[# dispatched], [# cycles]
 0,              20  (28.6%)
 4,              50  (71.4%)


Schedulers - number of cycles where we saw N micro opcodes issued:
[# issued], [# cycles]
 0,          3  (4.3%)
 2,          1  (1.4%)
 3,          66  (94.3%)

Scheduler's queue usage:
No scheduler resources used.


Retire Control Unit - number of cycles where we saw N instructions retired:
[# retired], [# cycles]
 0,           3  (4.3%)
 2,           1  (1.4%)
 3,           66  (94.3%)

Total ROB Entries:                128
Max Used ROB Entries:             59  ( 46.1% )
Average Used ROB Entries per cy:  32  ( 25.0% )


Register File statistics:
Total number of mappings created:    100
Max number of mappings used:         29


Resources:
[0.0] - TSV110UnitAB
[0.1] - TSV110UnitAB
[1]   - TSV110UnitALU
[2]   - TSV110UnitFSU1
[3]   - TSV110UnitFSU2
[4.0] - TSV110UnitLdSt
[4.1] - TSV110UnitLdSt
[5]   - TSV110UnitMDU


Resource pressure per iteration:
[0.0]  [0.1]  [1]    [2]    [3]    [4.0]  [4.1]  [5]
0.66   0.67   0.67    -      -      -      -      -

Resource pressure by instruction:
[0.0]  [0.1]  [1]    [2]    [3]    [4.0]  [4.1]  [5]    Instructions:
0.33    -     0.67    -      -      -      -      -     mov w0, #1
0.33   0.67    -      -      -      -      -      -     ret


Timeline view:
Index     0123456789

[0,0]     DeER .   .   mov  w0, #1
[0,1]     DeER .   .   ret
[1,0]     DeER .   .   mov  w0, #1
[1,1]     D=eER.   .   ret
[2,0]     .DeER.   .   mov  w0, #1
[2,1]     .DeER.   .   ret
[3,0]     .D=eER   .   mov  w0, #1
[3,1]     .D=eER   .   ret
[4,0]     . DeER   .   mov  w0, #1
[4,1]     . D=eER  .   ret
[5,0]     . D=eER  .   mov  w0, #1
[5,1]     . D=eER  .   ret
[6,0]     .  D=eER .   mov  w0, #1
[6,1]     .  D=eER .   ret
[7,0]     .  D=eER .   mov  w0, #1
[7,1]     .  D==eER.   ret
[8,0]     .   D=eER.   mov  w0, #1
[8,1]     .   D=eER.   ret
[9,0]     .   D==eER   mov  w0, #1
[9,1]     .   D==eER   ret


Average Wait times (based on the timeline view):
[0]: Executions
[1]: Average time spent waiting in a scheduler's queue
[2]: Average time spent waiting in a scheduler's queue while ready
[3]: Average time elapsed from WB until retire stage

      [0]    [1]    [2]    [3]
0.     10    1.7    1.7    0.0       mov    w0, #1
1.     10    2.0    2.0    0.0       ret
       10    1.9    1.9    0.0       <total>
IPCC Preliminary SLIC Optimization 6: Non-blocking MPI
非阻塞MPI
MPI_Send & MPI_receive
MPI_AllTogether()更慢,需要4s
手动向量化对齐
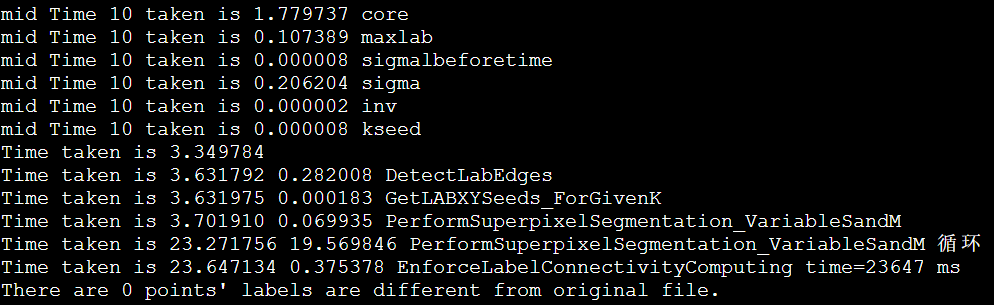
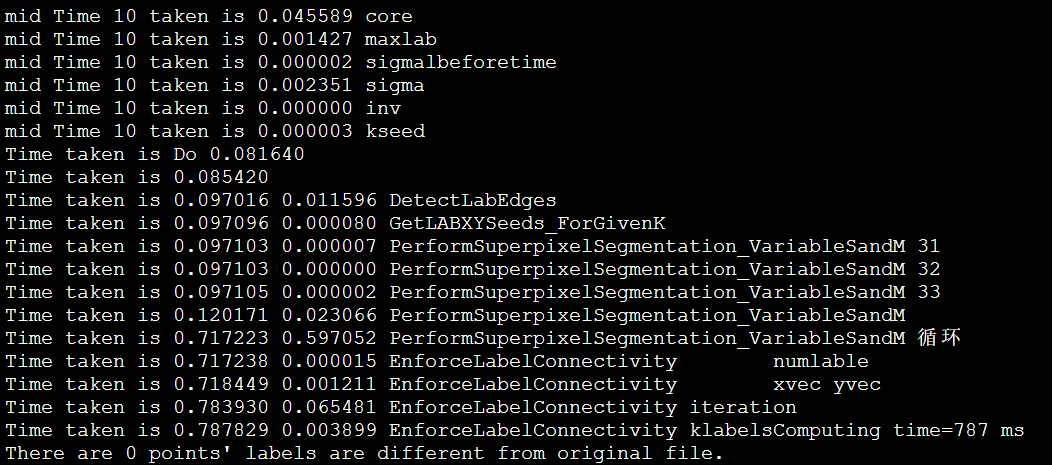
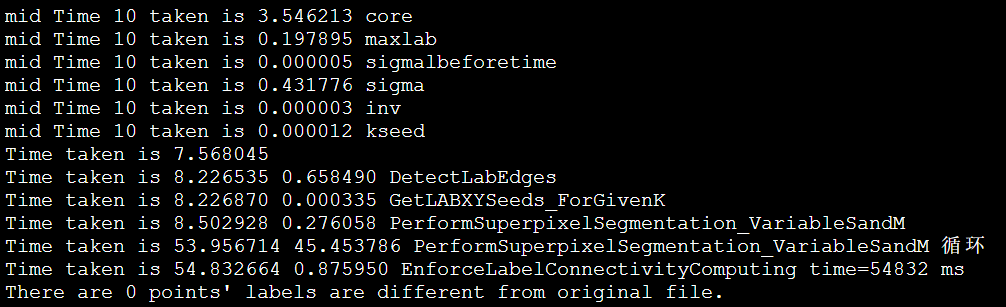
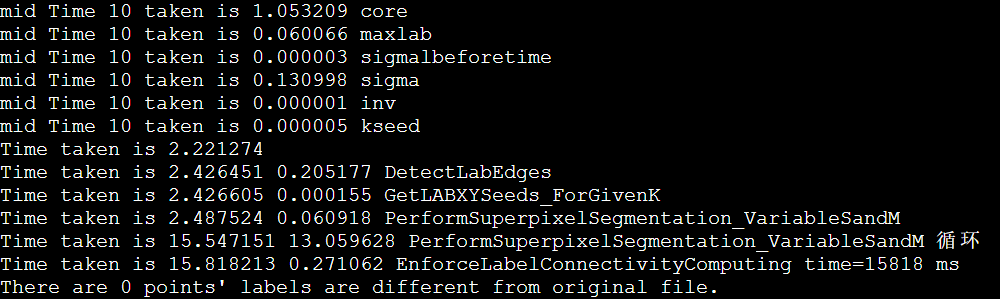
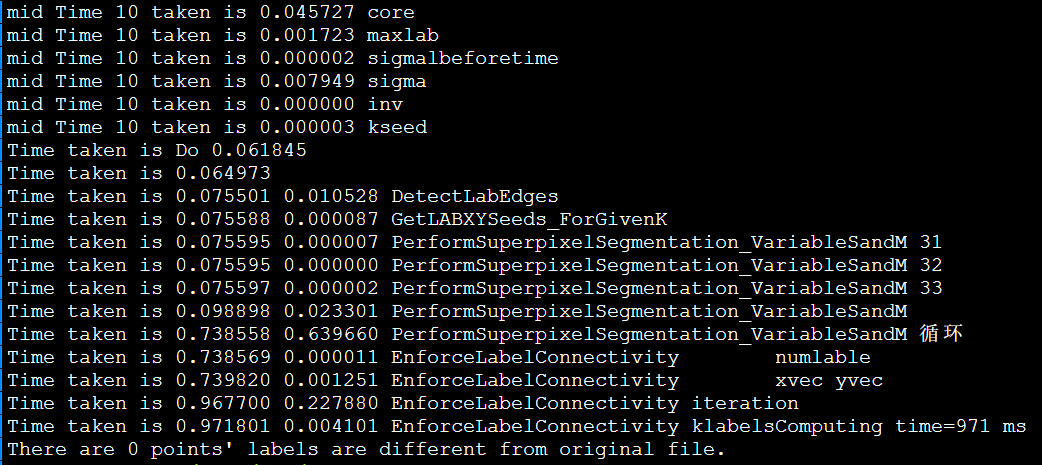
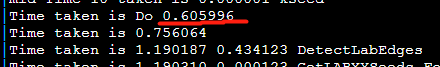
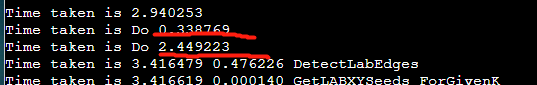
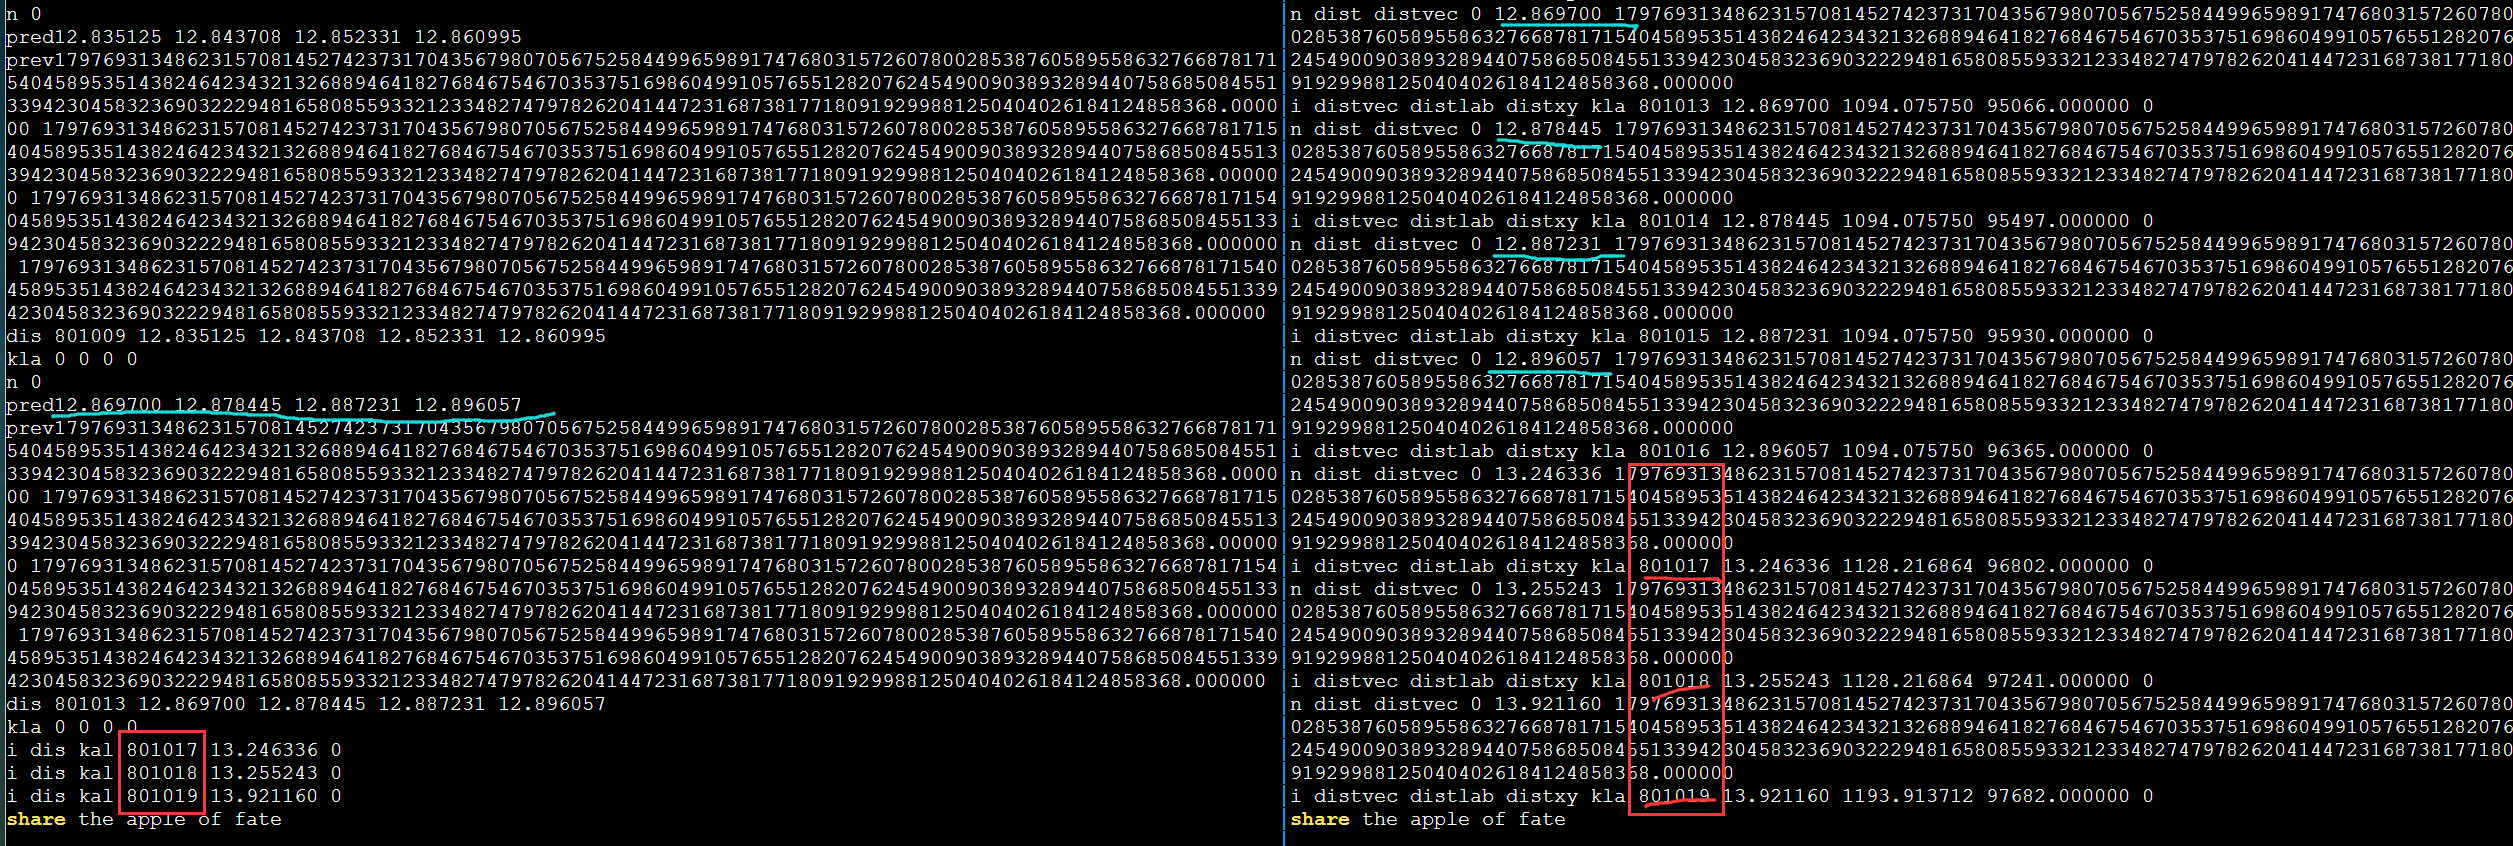
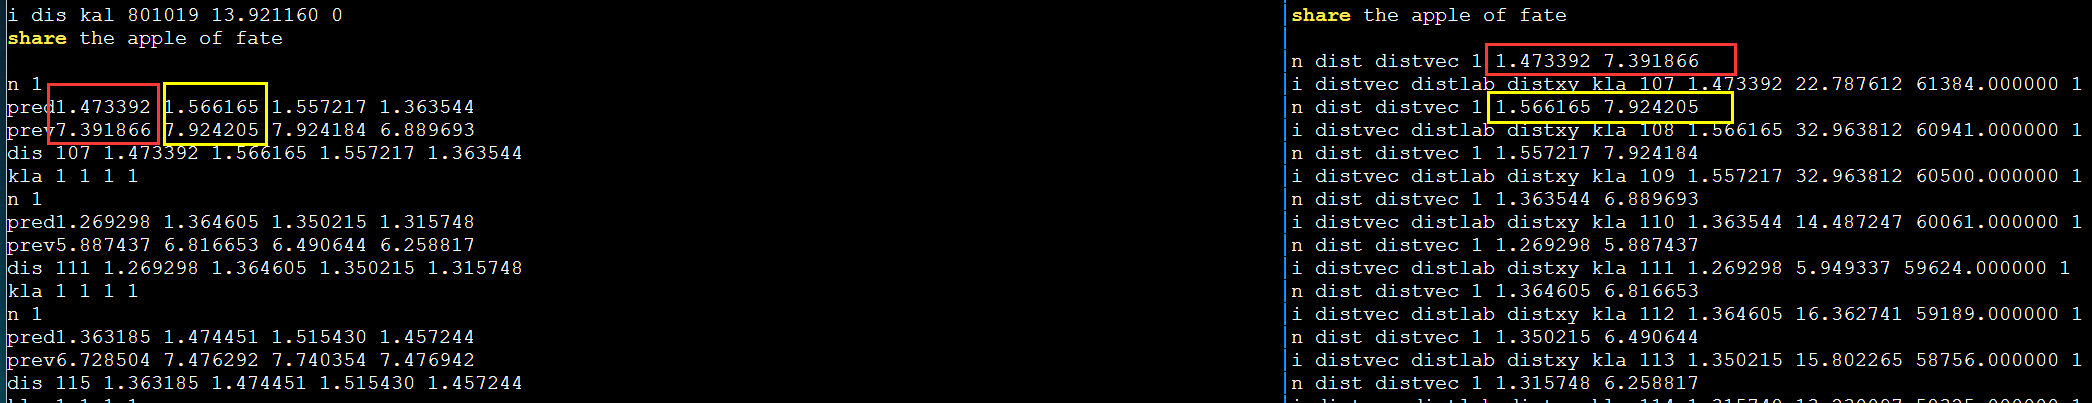
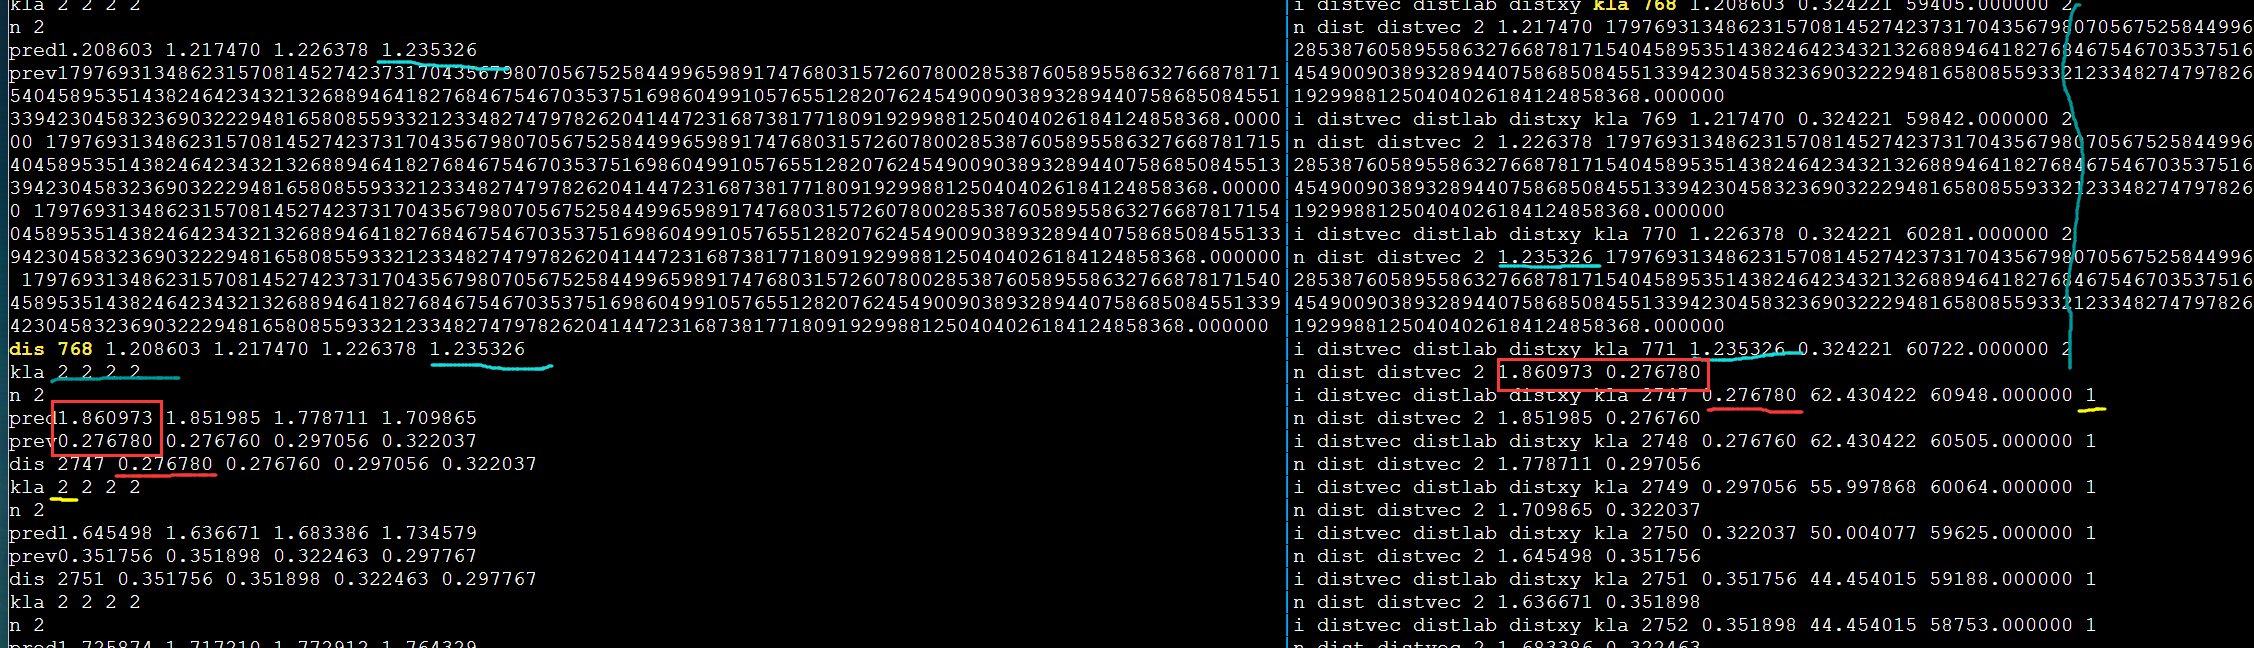
debug
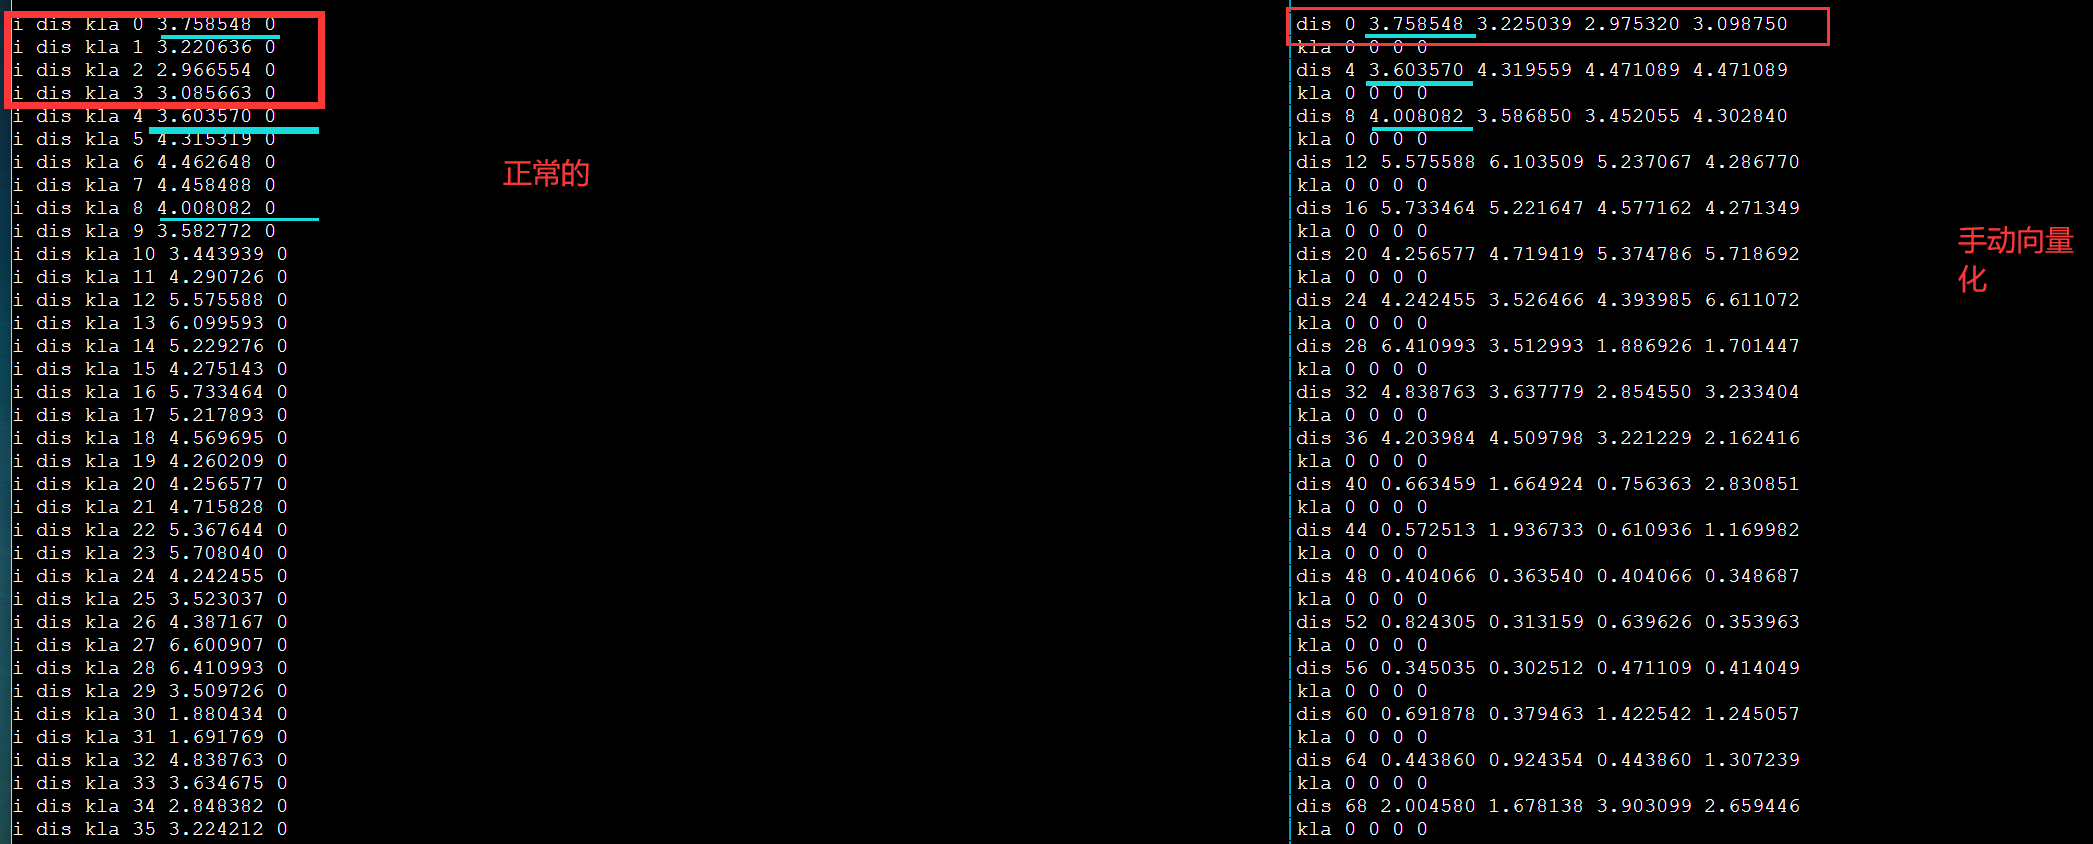
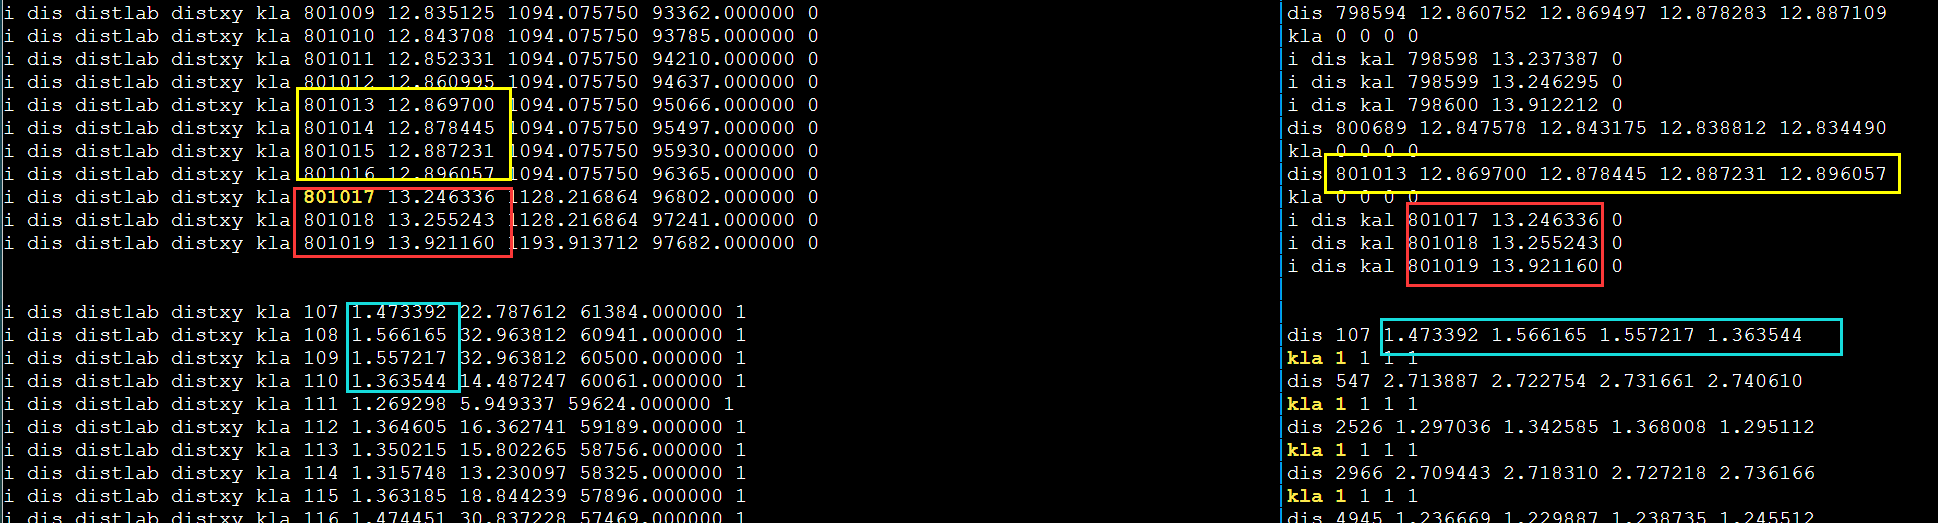
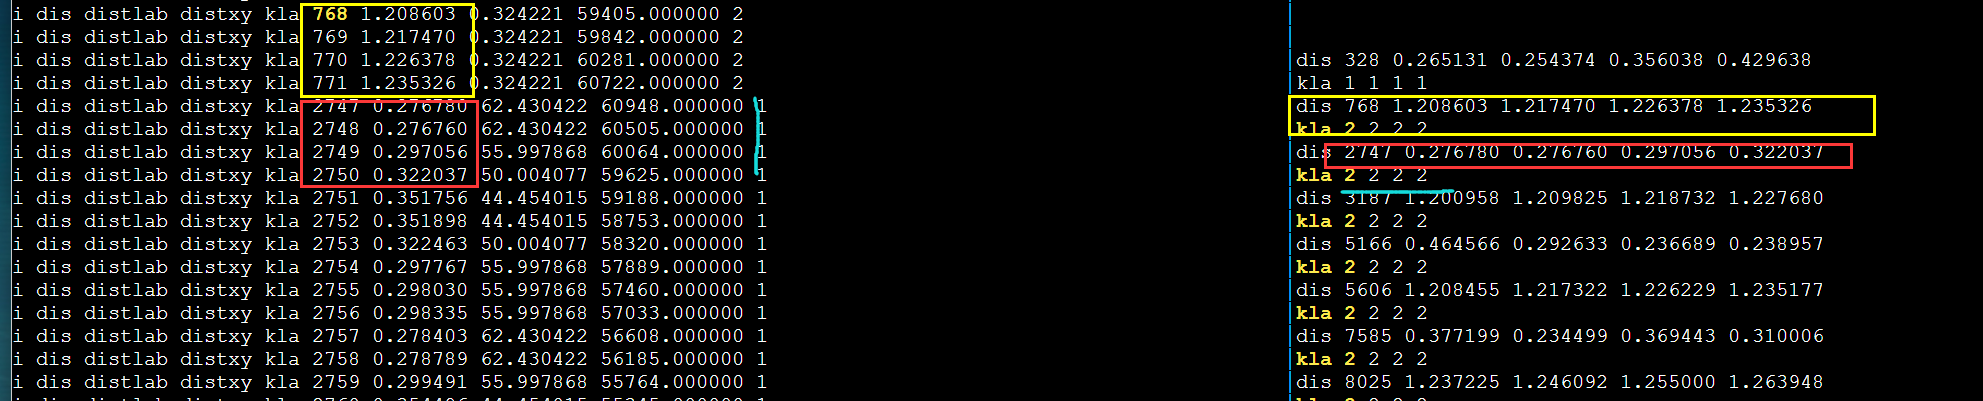
发现不对劲,打印更多输出。第一次循环肯定是对的因为和DBL_MAX比较。
需要进一步的研究学习
为什么明明有56GB的IB网,传输速度还是这么慢呢?写比较慢?
7*8=56 8条通道
遇到的问题
暂无
开题缘由、总结、反思、吐槽~~
参考文献
无
Hybrid Multithreaded/OpenMP + MPI parallel Programs
混合编程需要注意的问题
https://www.nhr.kit.edu/userdocs/horeka/batch_slurm_mpi_multithread/ 看这个
还有个ppt 16
google hydrid openmpi openmp
intelmpi 编译
这里值得要注意的是,似乎直接用mpif90/mpicxx编译的库会报错,所以需要用
icc -openmp hello.cpp -o hello -DMPICH_IGNORE_CXX_SEEK -L/Path/to/mpi/lib/ -lmpi_mt -lmpiic -I/path/to/mpi/include 其中-DMPICH_IGNORE_CXX_SEEK为防止MPI2协议中一个重复定义问题所使用的选项,为了保证线程安全,必须使用mpi_mt库
对于intel的mpirun,必须在mpirun后加上-env I_MPI_PIN_DOMAIN omp使得每个mpi进程会启动openmp线程。
通过export OMP_NUM_THREADS来控制每个MPI产生多少线程。
OpenMPI 如何实现mult-thread(OpenMP)2
检查编译安装支持mult-thread
shell$ ompi_info | grep "Thread support"
          Thread support: posix (MPI_THREAD_MULTIPLE: yes, OPAL support: yes, OMPI progress: no, Event lib: yes)
shell$
在C程序里支持mult-thread
#include <mpi.h>
int MPI_Init_thread(int *argc, char ***argv,
    int required, int *provided)

argc
        C/C++ only: Pointer to the number of arguments.
argv
        C/C++ only: Argument vector.
required
        Desired level of thread support (integer).
provided
        Available level of thread support (integer).
MPI_THREAD_SINGLE
        Only one thread will execute.
MPI_THREAD_FUNNELED
        If the process is multithreaded, only the thread that called MPI_Init_thread will make MPI calls.
MPI_THREAD_SERIALIZED
        If the process is multithreaded, only one thread will make MPI library calls at one time.
MPI_THREAD_MULTIPLE
        If the process is multithreaded, multiple threads may call MPI at once with no restrictions.
注意
3.1.6的多线程支持还在初级阶段。开销很高(虽然我不知道为什么)
需要进一步的研究学习
学习MapReduce或者Hadoop? pthread vs openmp?
遇到的问题
暂无
开题缘由、总结、反思、吐槽~~
参考文献
https://blog.csdn.net/Morizen/article/details/113863591